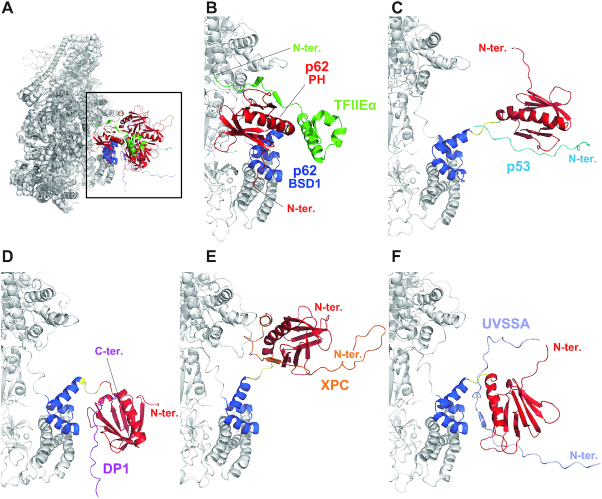
Figure 6.
MD simulation models of the complexes of human TFIIH with p62-binding partners. (A) Overall view. Extended view of the area indicated by the square in (A): (B) complex of TFIIH and TFIIEα; (C) complex of TFIIH and p53; (D) complex of TFIIH and DP1; (E) complex of TFIIH and XPC; and (F) complex of TFIIH and UVSSA.

