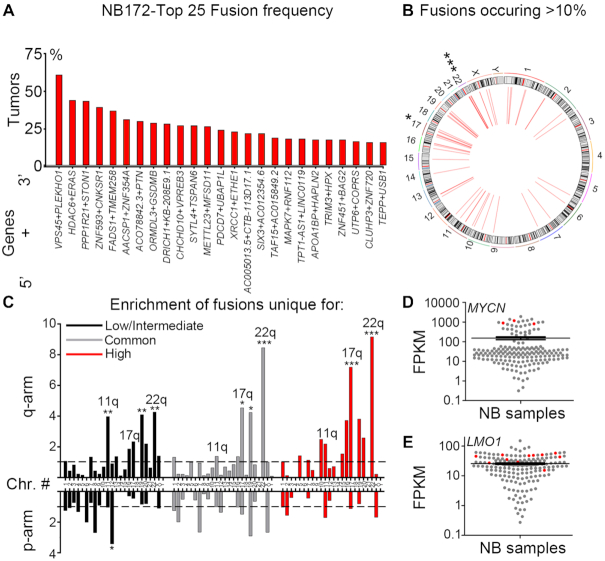
Figure 1.
Identification of fusion transcripts in neuroblastoma tumors. (A) Top 25 most frequent fusions identified by FusionCatcher in a cohort of 172 paired end RNA sequenced neuroblastoma patient samples derived from the NCI TARGET project (NB172). (B) Circos plot of genomic distribution of top frequent fusions (>10%) in NB172. (C) Enrichment of fusion transcripts common or unique to low/intermediate-risk or high-risk tumors in chromosomal arms as calculated by a normalized enrichment score = (counts of fusion transcripts in each chromosomal arm / length of chromosomal arm (Mb)) / average enrichment. (D, E) MYCN/LMO1 expression levels are high in neuroblastoma tumors (red) bearing fusion transcripts of which one fusion partner is either MYCN or LMO1, as shown by expression value FPKM (Fragments Per Kilobase per Million mapped reads). P-values in (B,C) were calculated from Z-values, assuming standard normal distribution. *P< 0.05, **P< 0.01, ***P< 0.001.

