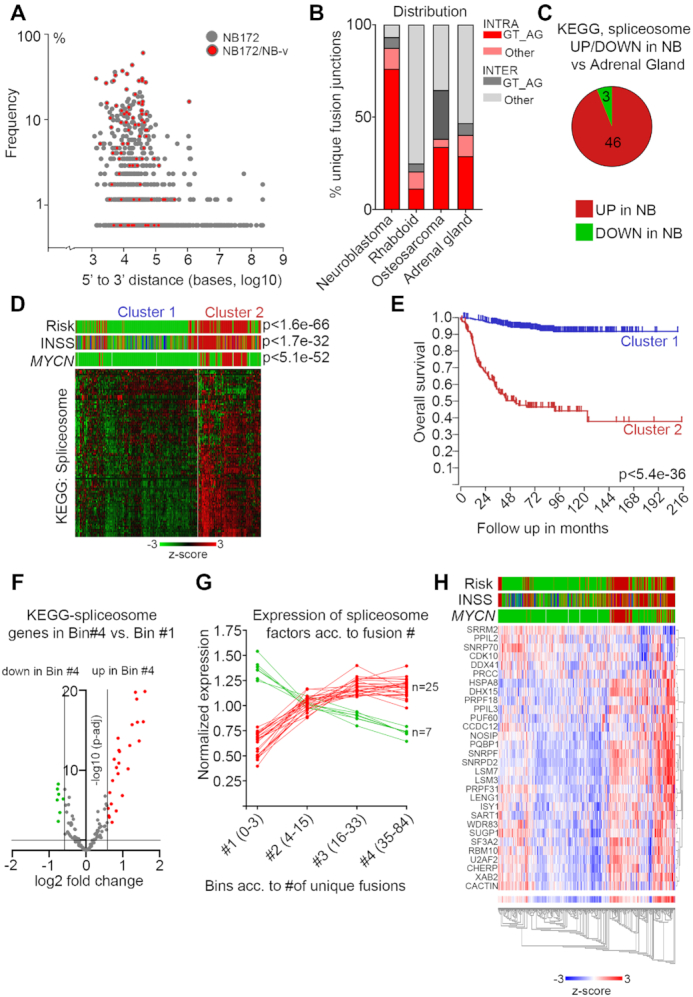
Figure 4.

Enrichment of canonical splicing pattern at fusion junctions and aberrant spliceosome activity in high-risk neuroblastoma. (A) Plot of the frequency versus the distance from 5′ to 3′ in the intrachromosomal fusion transcript identified in the NB discovery cohort (NB172); each dot represents a unique fusion transcript; fusion transcripts re-identified in the NB validation cohort (NB-v) were marked as red. (B) Distribution of unique intrachromosomal vs interchromosomal fusion junctions flanked by GT_AG or other nucleotide motifs in neuroblastoma, rhabdoid tumor, osteosarcoma and normal adrenal gland. (C) Differential expression of genes (>1.5×, adj P< 0.05) in the KEGG Spliceosome pathway for neuroblastoma dataset (NBL172) versus human normal adrenal gland dataset. (D) K-means analysis of the 498-SEQC dataset from the R2 database, utilizing the genes in the KEGG spliceosome pathway, generates two clusters with significant differences in Risk, INSS and MYCN-amplification. (E) Overall survival probability of the two clusters identified in (D). (F) Volcano plot showing differential expression of genes belonging to the KEGG Spliceosome category between the tumors with the highest number of unique fusion transcripts (Bin #4) and the tumors with the lowest number (Bin #1). Spliceosome genes with significantly higher expression in Bin #4 are labeled in red and spliceosome genes with significantly lower expression in Bin #4 are labeled green. (G) Normalized expression levels of the genes identified in (F) from Bin #1 to Bin #4. (H) Heatmap and associated clinical classification (Risk, INSS and MYCN status) of the spliceosome genes identified as significantly differentially expressed in (F).
