Figure 3.
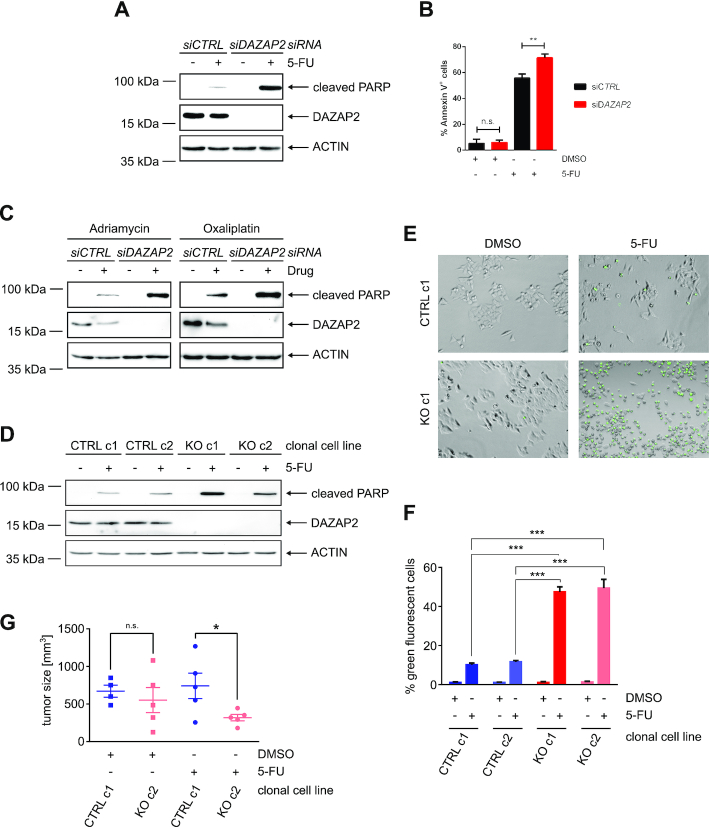
Loss of DAZAP2 sensitizes cancer cells to chemotherapeutic drug treatment. (A, B) DAZAP2 depletion sensitizes HCT116 cells to 5-FU treatment. HCT116 cells were transfected with DAZAP2-specific or control siRNAs and DNA damage was induced using 50 μM 5-FU. (A) Cells were harvested 24 h post-treatment and lysates were analyzed by immunoblotting. n = 3. (B) Cells were harvested 48 h post-treatment and co-stained with Annexin V and PI. Stained cells were analyzed by flow cytometry. Bar graph showing quantification of % Annexin V-positive cells + SD from three biological replicates. ** P-value ≤ 0.01, ns non-significant (un-paired t-test). n = 3. (C) DAZAP2 depletion sensitizes HCT116 cells to Adriamycin and Oxaliplatin. HCT116 cells were transfected with DAZAP2-specific or control siRNAs and DNA damage was induced for 24 h using 0.75 μg/ml Adriamycin or 50 μM Oxaliplatin. Cell lysates were analyzed by immunoblotting. n = 3. (D) DAZAP2 deletion chemosensitizes cells. HCT116 control CRISPR/Cas9 and DAZAP2 knockout CRISPR/Cas9 clonal cell lines were treated with 50 μM 5-FU for 24 h and total protein lysates were subjected to immunoblot analysis for the expression of the indicated proteins. n = 3. (E, F) DAZAP2 deletion increases Caspase-3/7 activity upon DNA damage. HCT116 CRISPR/Cas9 control and CRISPR/Cas9 DAZAP2 knockout clonal cell lines were treated with 50 μM 5-FU and Caspase-3/7 activity was assessed 24 h post-treatment by fluorescence microscopy. n = 3. (E) Representative image of cells with active Caspase-3/7 (green) are shown. (F) Bar graph represents mean and SD of % NucView-positive, green cells from three images. (G) DAZAP2 deletion sensitizes tumors to chemotherapeutic drug treatment in vivo. CRISPR/Cas9 DAZAP2 KO or control CRISPR/Cas9 HCT116 cells were subcutaneously injected into NOD/SCID mice. When the tumor size reached 100 mm3, mice were treated with DMSO or 50 mg/kg 5-FU for 21 days. Analysis of weight of tumor size after 21 days of treatment is shown. Data are displayed as sample mean ± standard error of the mean. * P-value ≤0.05, ns non-significant (unpaired t-test).

