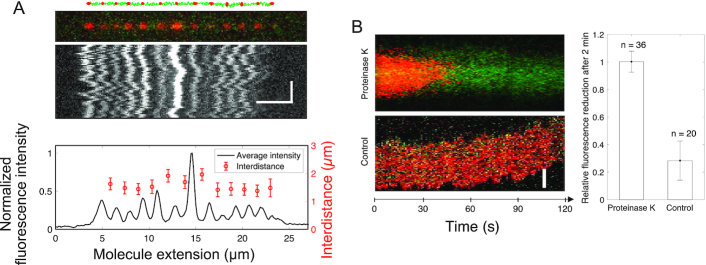
Figure 4.
Ku remains stably bound to DNA post ligation. (A) Schematic of 10 000 bp blunt-ended DNA fragments (green) ligated by LigD, where KuAF647 (red) is stably bound to the ends and junctions post ligation, together with the corresponding fluorescence microscopy image where the DNA–protein complex has been stretched in a nanofluidic channel (100 × 100 nm2). The fluorescence intensity plot (black) displays variation in the emission from the equally spaced KuAF647 (red), normalized to the highest emission intensity observed. The error bars correspond to the standard deviation. Horizontal and vertical scale-bars correspond to 5 μm and 2 s, respectively. (B) Kymograph showing the emission from KuAF647 (red) and YOYO-1 labelled DNA (green) with time upon addition of Proteinase K in situ (top) in nanochannels with a dimension of 300 × 130 nm2 that allow for active addition of protein solution to the confined DNA–protein complex. The minimal level of photobleaching of KuAF647 is displayed in the control kymograph (bottom). The histogram reports the average relative reduction in fluorescence emission from KuAF647 after 2 min with or without Proteinase K (n = 36 and n = 20, respectively). Scale-bar corresponds to 5 μm.

