
Figure 1.
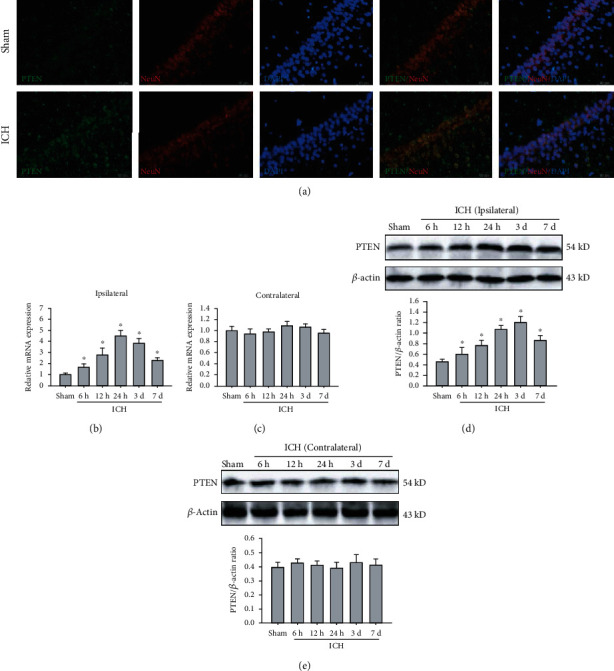
ICH caused an increase in endogenous PTEN in the ipsilateral hippocampus. (a) Representative images of double immunofluorescence staining for PTEN (green) and NeuN (red) in the hippocampal CA1 region. Bar, 50 μm. (b, c) The mRNA level of PTEN in the ipsilateral (b) and contralateral hippocampus (b) were examined by real-time PCR. GAPDH serves as a loading control. (d, e) The protein expression of PTEN in the ipsilateral (d) and contralateral hippocampus (e) was measured by Western blot. β-Actin was used as a loading control. ∗P < 0.05 compared with the Sham group.