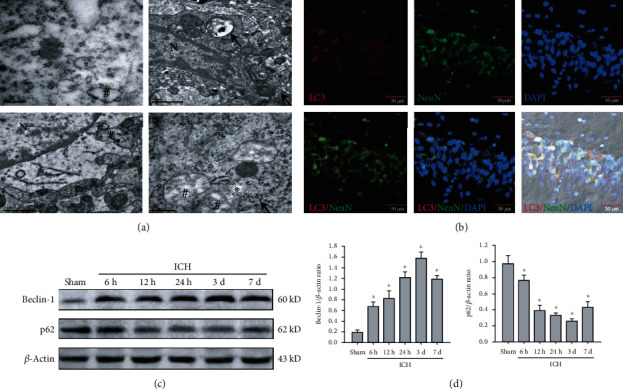
Figure 4.

ICH triggered autophagy activation in the nonhemorrhagic hippocampus. (a) Representative images of electron microscopy in the ipsilateral hippocampus after ICH. The asterisk symbol indicated phagophore, the hash symbol presented typical autophagosomes, and the arrow showed the formation of autolysosomes. Bar, 1 μm. (b) The colocalization of LC3 (red) in the neuron (green) of the hippocampal CA1 region after ICH. Bar, 30 μm. (c, d) Representative bands and quantitative analysis of Beclin-1 and p62 in the ipsilateral hippocampus. ∗P < 0.05 compared with the Sham group; #P < 0.05 compared with the ICH group.
