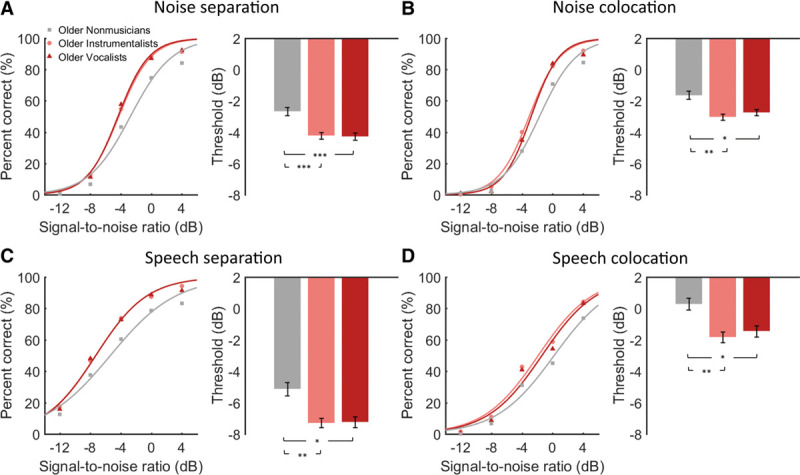
Fig. 2.

Group mean percent of correct as a function of signal-to-noise ratio (left panel) and the mean speech-in-noise threshold (right panel) in older nonmusicians, older instrumentalists, and older vocalists under (A) noise separation, (B) noise colocation, (C) speech separation, and (D) speech colocation. Error bars indicate standard error of the mean. *p < 0.05, **p < 0.01, ***p < 0.001, one-way ANOVA followed by Tukey’s multiple comparison tests.
