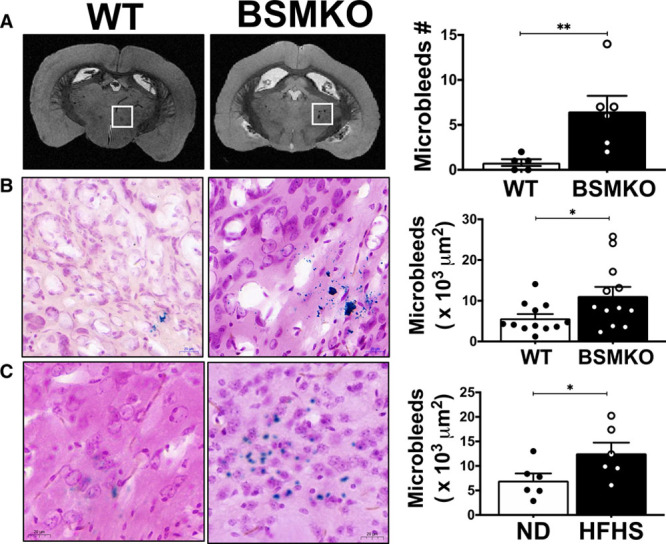
Figure 8.

Cerebral microbleeds in wild-type (WT) vs tamoxifen-inducible VSM-specific Bcl11b null mice (BSMKO). A, Representative magnetic resonance imaging (MRI) of whole brains from WT (n=5) and BSMKO mice (n=6). A microbleed-rich region is highlighted with the white box. Quantitation in graph. **P=1.0×10⁻² by unpaired t test. B, Representative histological staining of WT (n=12) and BSMKO (n=12) brain sections (40× magnification); areas stained in blue are indicative of cerebral microbleeds. Quantitation in graph (µm2). Each dot represents the average of at least 5 sections, corresponding to a cumulative thickness of 150 µm, for each mouse. *P=3.0×10⁻² by unpaired t test. C, Representative histological staining of cerebral microbleeds in normal diet (ND)- (n=6) and high fat, high sucrose (HFHS)-fed (n=6) mice. Quantitation in graph. *P=5.0×10⁻² by unpaired t test.
