
FIGURE 2.
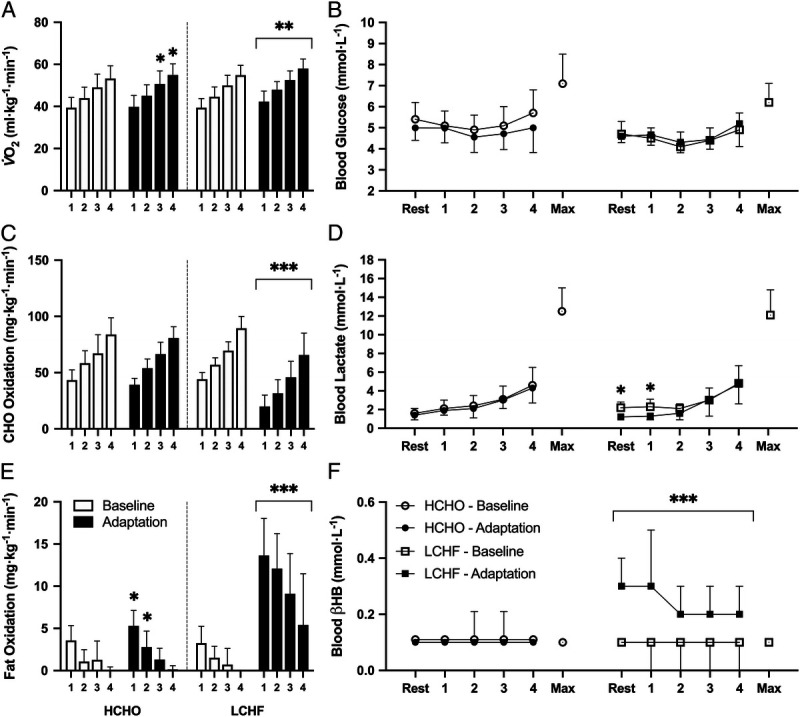
Relative oxygen uptake (A), substrate utilization (C, CHO; E, fat oxidation), and blood metabolite concentrations (B, blood glucose [mmol·L−1]; D, blood lactate [mmol·L−1]; and F, blood βHB [mmol·L−1]) during the four-stage economy test performed before and after adaptation to either an LCHF (n = 9) or an HCHO (n = 9) diet. Data are presented as mean ± SD. Significant differences within group relative to baseline are denoted by *P < 0.05, **P < 0.005, ***P < 0.0001.