
FIGURE 7.
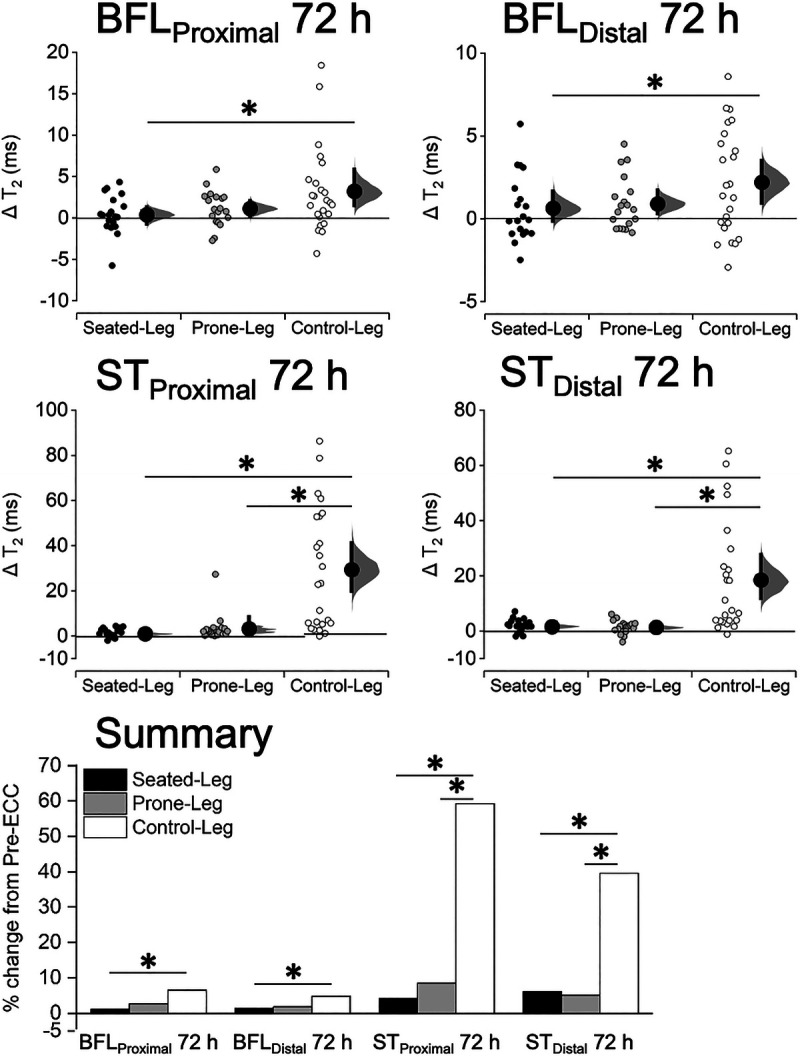
Changes in T2 of the BFL and ST at 30% (BFLProximal, STProximal) and 70% (BFLDistal, STDistal) of the thigh length at 72 h after eccentric exercise for Seated-Leg, Prone-Leg, and Control-Leg. Data are plotted as individual raw change (Δ) values from baseline (small dots), with a group mean (larger dots) and its 95% CI (indicated by the ends of the vertical error bars) shown together. The CI and the bootstrap sampling distributions (5000 samples, bias-corrected and accelerated) were obtained from respective paired (pre- to postexercise) data. *Significant difference between legs at P < 0.05 based on a baseline-adjusted ANCOVA and an LSD post hoc test. n = 19 legs for both Seated-Leg and Prone-Leg, and 24 legs for Control-Leg. The bar graphs in the summary figure are based on the mean changes for each muscle.