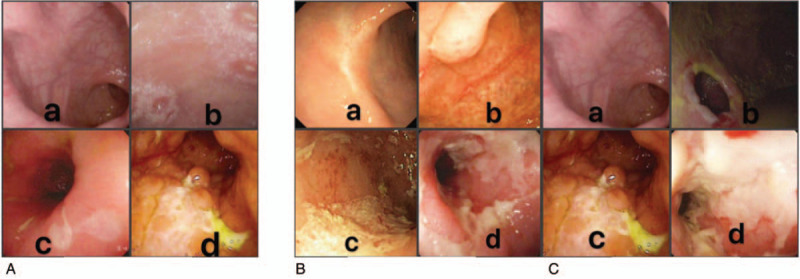
Figure 1.

The specific scores of ulcers, proportion of the surface covered by ulcers and stenosis are shown from (A) to (C). (A) Ulcers a. 0: none; b. 1: aphtous ulcers (< 0.5 cm); c. 2: large ulcers (from 0.5 to 2 cm); d. 3: very large ulcers (> 2 cm). (B) Proportion of the surface covered by ulcers a. 0: surface involved by ulcerations 0% (none); b. 1: surface involved by ulcerations < 10%; c. 2: surface involved by ulcerations 10--30%; d. 3: surface involved by ulcerations > 30%. (C) Stenosis a. 0: none; b. 1: single, can be passed; c. 2: multiple, can be passed; d. 3: cannot be passed.
