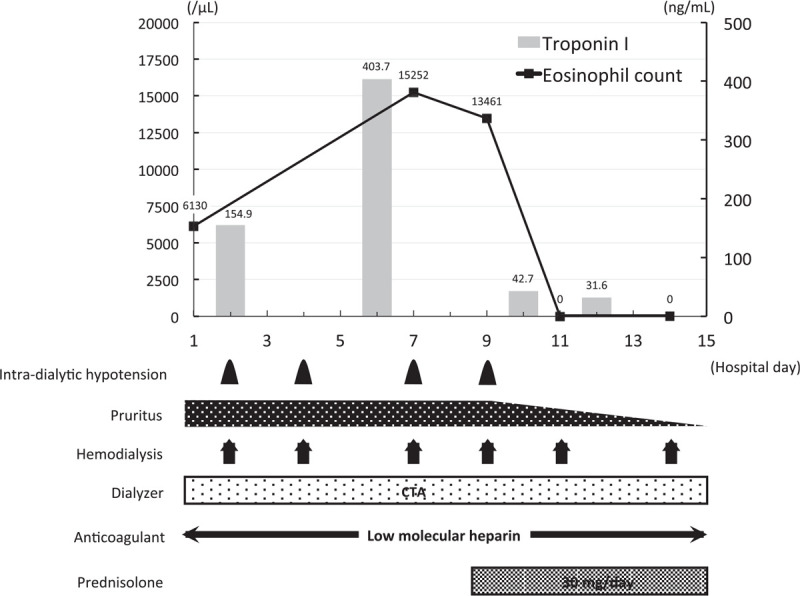
Figure 2.

Clinical course of case 2. The x axis of the graph shows the number of days from admission and the y axis shows the eosinophil count (line) and the serum troponin I concentration (bars). The frequencies or durations of each clinical problem and treatment are shown below. CTA = cellulose triacetate.
