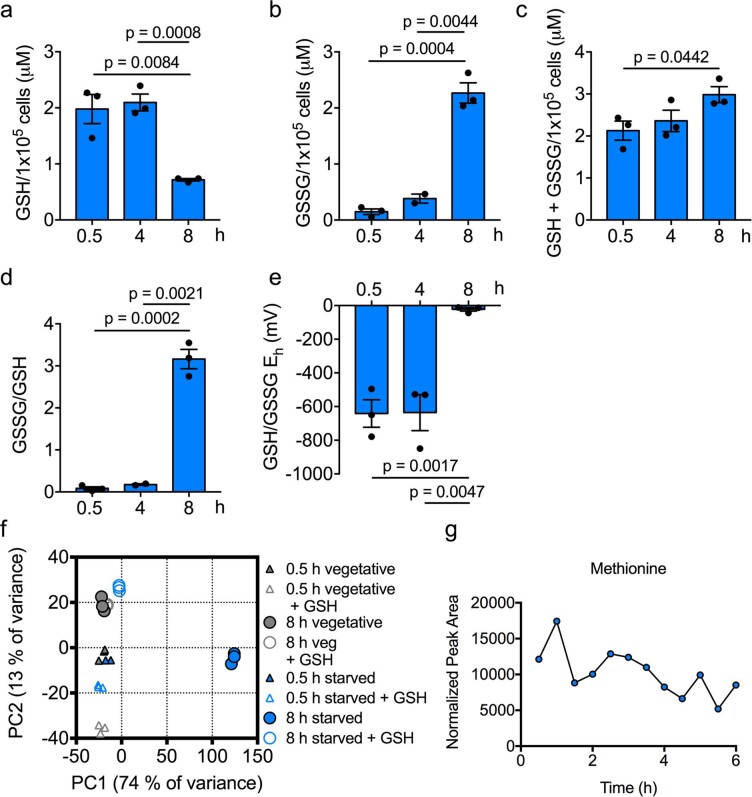
Extended Data Fig. 7. GSH oxidation is increased in starving D. discoideum.
a–e, Quantification of GSH (a), GSSG (b) and total glutathione (c) levels, the GSSG/GSH ratio (d) and the redox potential (Eh) of the GSH–GSSG couple (e) over time in starving D. discoideum (n = 3). f, Principal component analysis of bulk RNA-seq of vegetative or starved D. discoideum cultured for 0.5 or 8 h, with or without 10 mM GSH (n = 3). g, GC–MS analysis of methionine levels in starving D. discoideum (n = 3). In a–e, data are mean ± s.e.m. n represents independent biological replicates. Statistical significance was calculated using a two-tailed Student’s t-test.

