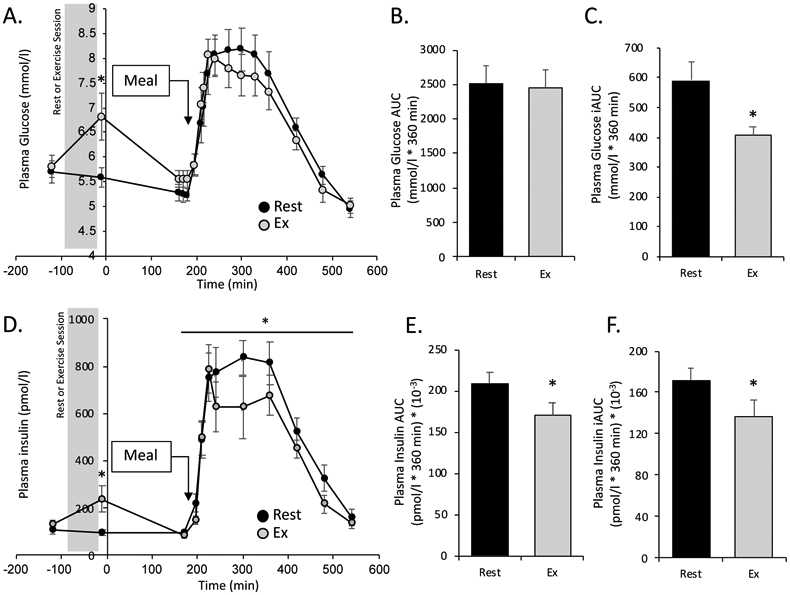
Figure 2. Plasma Glucose and Insulin Concentration.

Plasma glucose and insulin concentrations measured throughout the study (mean ± SEM). Time point “0” corresponds to the start of the [6,6-2H2]glucose tracer. A. Plasma glucose (mmol/l). B & C. Postprandial total and incremental area under the curve (AUC and iAUC respectively) for plasma glucose concentration. D. Plasma insulin (pmol/l). * denotes significant elevation in plasma glucose at time -10 min in RE condition (paired t-test), and significant main effect of treatment (RE < rest) for postprandial insulin concentration (repeated-measures ANOVA, see text for p-values). E & F. Postprandial total and incremental (AUC and iAUC respectively) for plasma insulin. In B, C, E, and F * denotes significant difference between rest and exercise (paired t-test, p<0.05).
