
Figure 3. Postprandial Glucose Kinetics and Insulin Sensitivity.
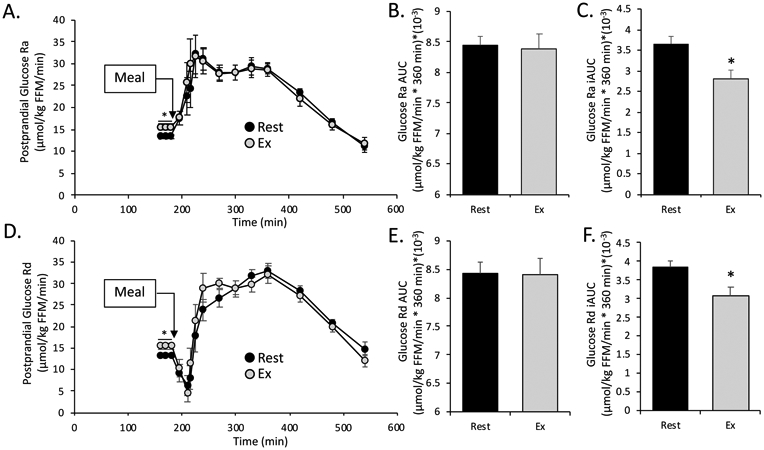
All values are mean ± SEM. A. Postprandial glucose rate of appearance (Ra). B & C. Postprandial total and incremental area under the curve (AUC and iAUC respectively) for glucose Ra. D. Postprandial glucose rate of disappearance (Rd). E & F. Postprandial total and incremental area under the curve (AUC and iAUC respectively) for glucose Rd. In all graphs * denotes significant difference between rest vs exercise (paired t-test. p<0.05).