Fig. 1.
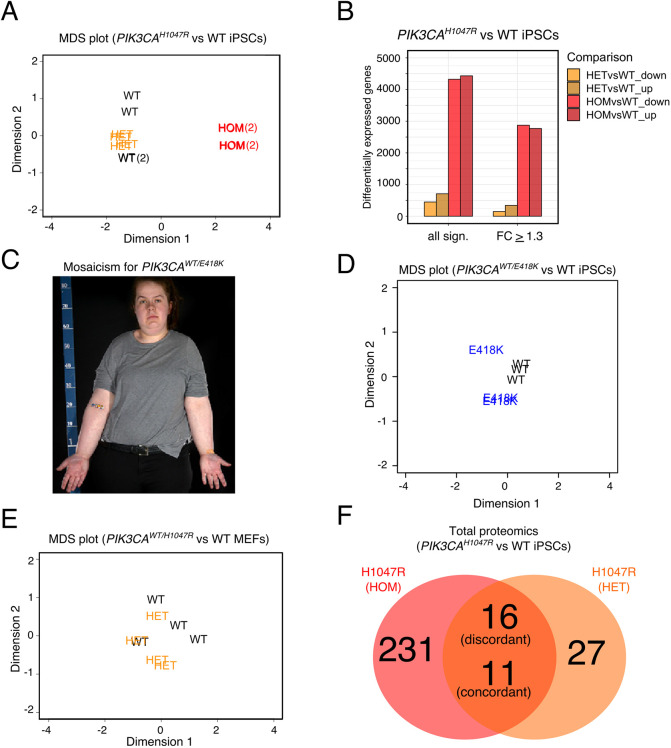
Transcriptomic and proteomic analyses of human and mouse cell lines with endogenous expression of oncogenic PIK3CA. (A) MDS plot of the transcriptomes of wild-type (WT), PIK3CAWT/H1047R (HET) and PIK3CAH1047R/H1047R (HOM) human iPSCs. The numbers in brackets indicate the presence of two closely overlapping samples. (B) The number of differentially expressed genes in iPSCs heterozygous or homozygous for PIK3CAH1047R before and after application of an absolute fold-change cutoff of ≥1.3 [false discovery rate (FDR), ≤0.05, Benjamini-Hochberg]. The data are based on four iPSC cultures from a minimum of two clones per genotype. See also Fig. S1. (C) Woman with asymmetric overgrowth caused by mosaicism for cells with heterozygous expression of PIK3CAE418K. Skin biopsies obtained from unaffected and affected tissues were used to obtain otherwise isogenic dermal fibroblasts for subsequent reprogramming into iPSCs. This image was reproduced from Parker et al., (2019). (D) MDS plot of the transcriptomes of wild-type (WT) and PIK3CAWT/E418K iPSCs (based on three independent mutant clones and three wild-type cultures from two independent clones). (E) MDS plot of the transcriptomes of wild-type (WT) and PIK3CAWT/H1047R (HET) MEFs following 48 h of mutant induction (N=4 independent clones per genotype). (F) Venn diagram showing the number of differentially expressed proteins in PIK3CAH1047R/H1047R (HOM) and PIK3CAWT/H1047R (HET) iPSCs relative to wild-type controls, profiled by label-free total proteomics on three clones per genotype. An absolute fold-change and z-score ≥1.2 were used to classify proteins as differentially expressed. The number of discordant and concordant changes in the expression of total proteins detected in both comparisons are indicated. See also Fig. S2.

