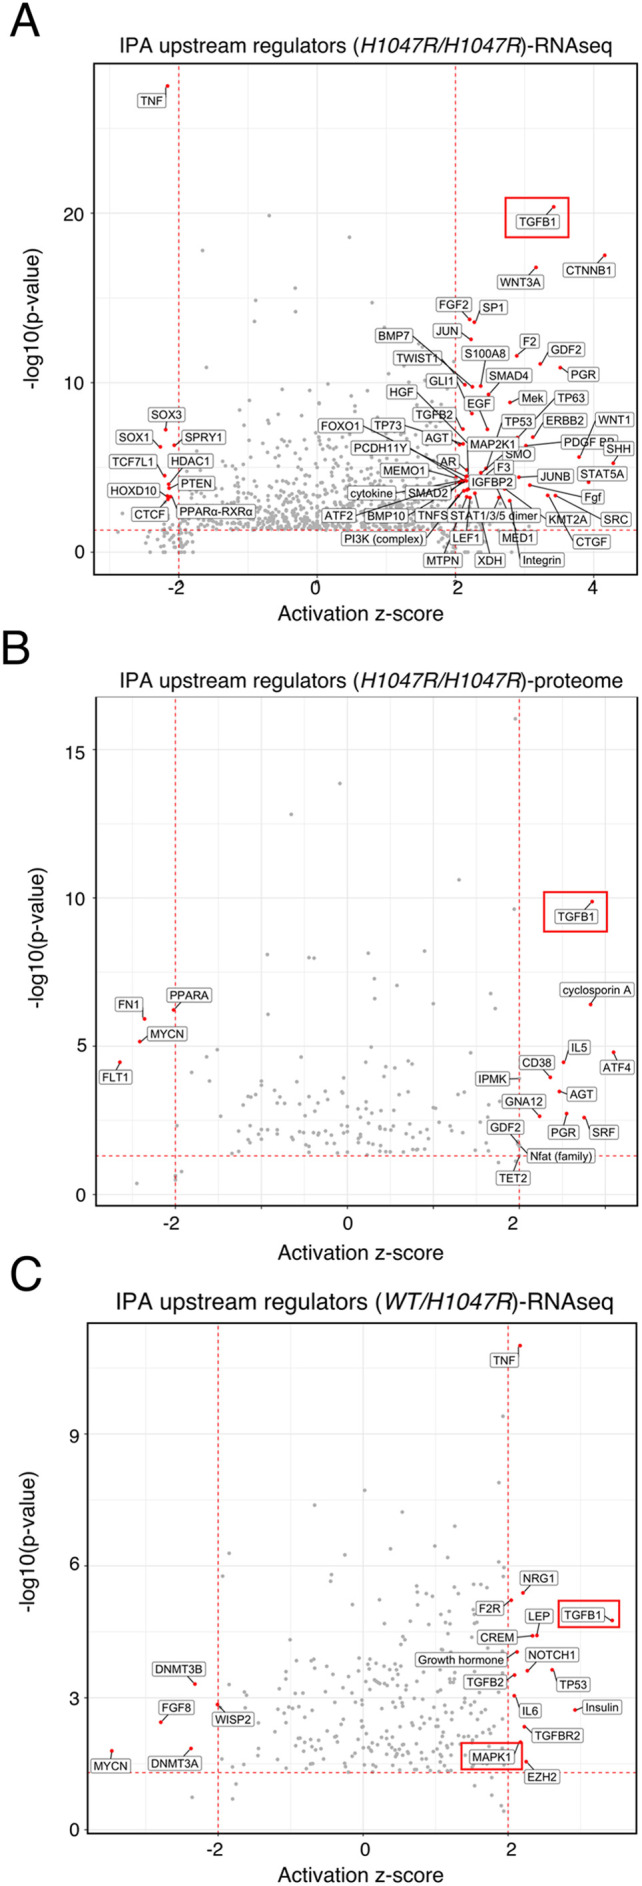
Fig. 3.

IPAs predict activation of TGFβ signalling in heterozygous and homozygous PIK3CAH1047R iPSCs. (A) IPA of upstream regulators using the list of the top 2000 upregulated and top 2000 downregulated mRNA transcripts in PIK3CAH1047R/H1047R iPSCs (for RNA-seq details, see Fig. 1A,B). Red points signify transcripts with an absolute predicted activation z-score of >2 and overlap P<0.001 (Fisher's Exact Test). The red rectangle highlights the most significant upstream regulator, TGFβ1. This analysis does not differentiate between NODAL, TGFβ1 and Activin, which all act through the same pathway in hPSCs. (B) As in A but using the list of differentially expressed proteins identified by total proteomics and red-colouring targets with a predicted activation z-score of >2 and overlap P<0.05 (Fisher's Exact Test). (C) As in A but using the list of differentially expressed transcripts in PIK3CAWT/H1047R iPSCs and red-colouring upstream regulators with an absolute predicted bias-corrected z score of >2 and overlap P<0.05 (Fisher's Exact Test). Red rectangles highlight the two upstream regulators (TGFβ1 and MAPK1) with an absolute predicted bias-corrected z score of >2 that remained significant (overlap P<0.05) when the analysis was repeated using the list of shared and concordant differentially expressed genes (N=180) in heterozygous and homozygous PIK3CAH1047R iPSCs versus wild-type controls.
