Fig.

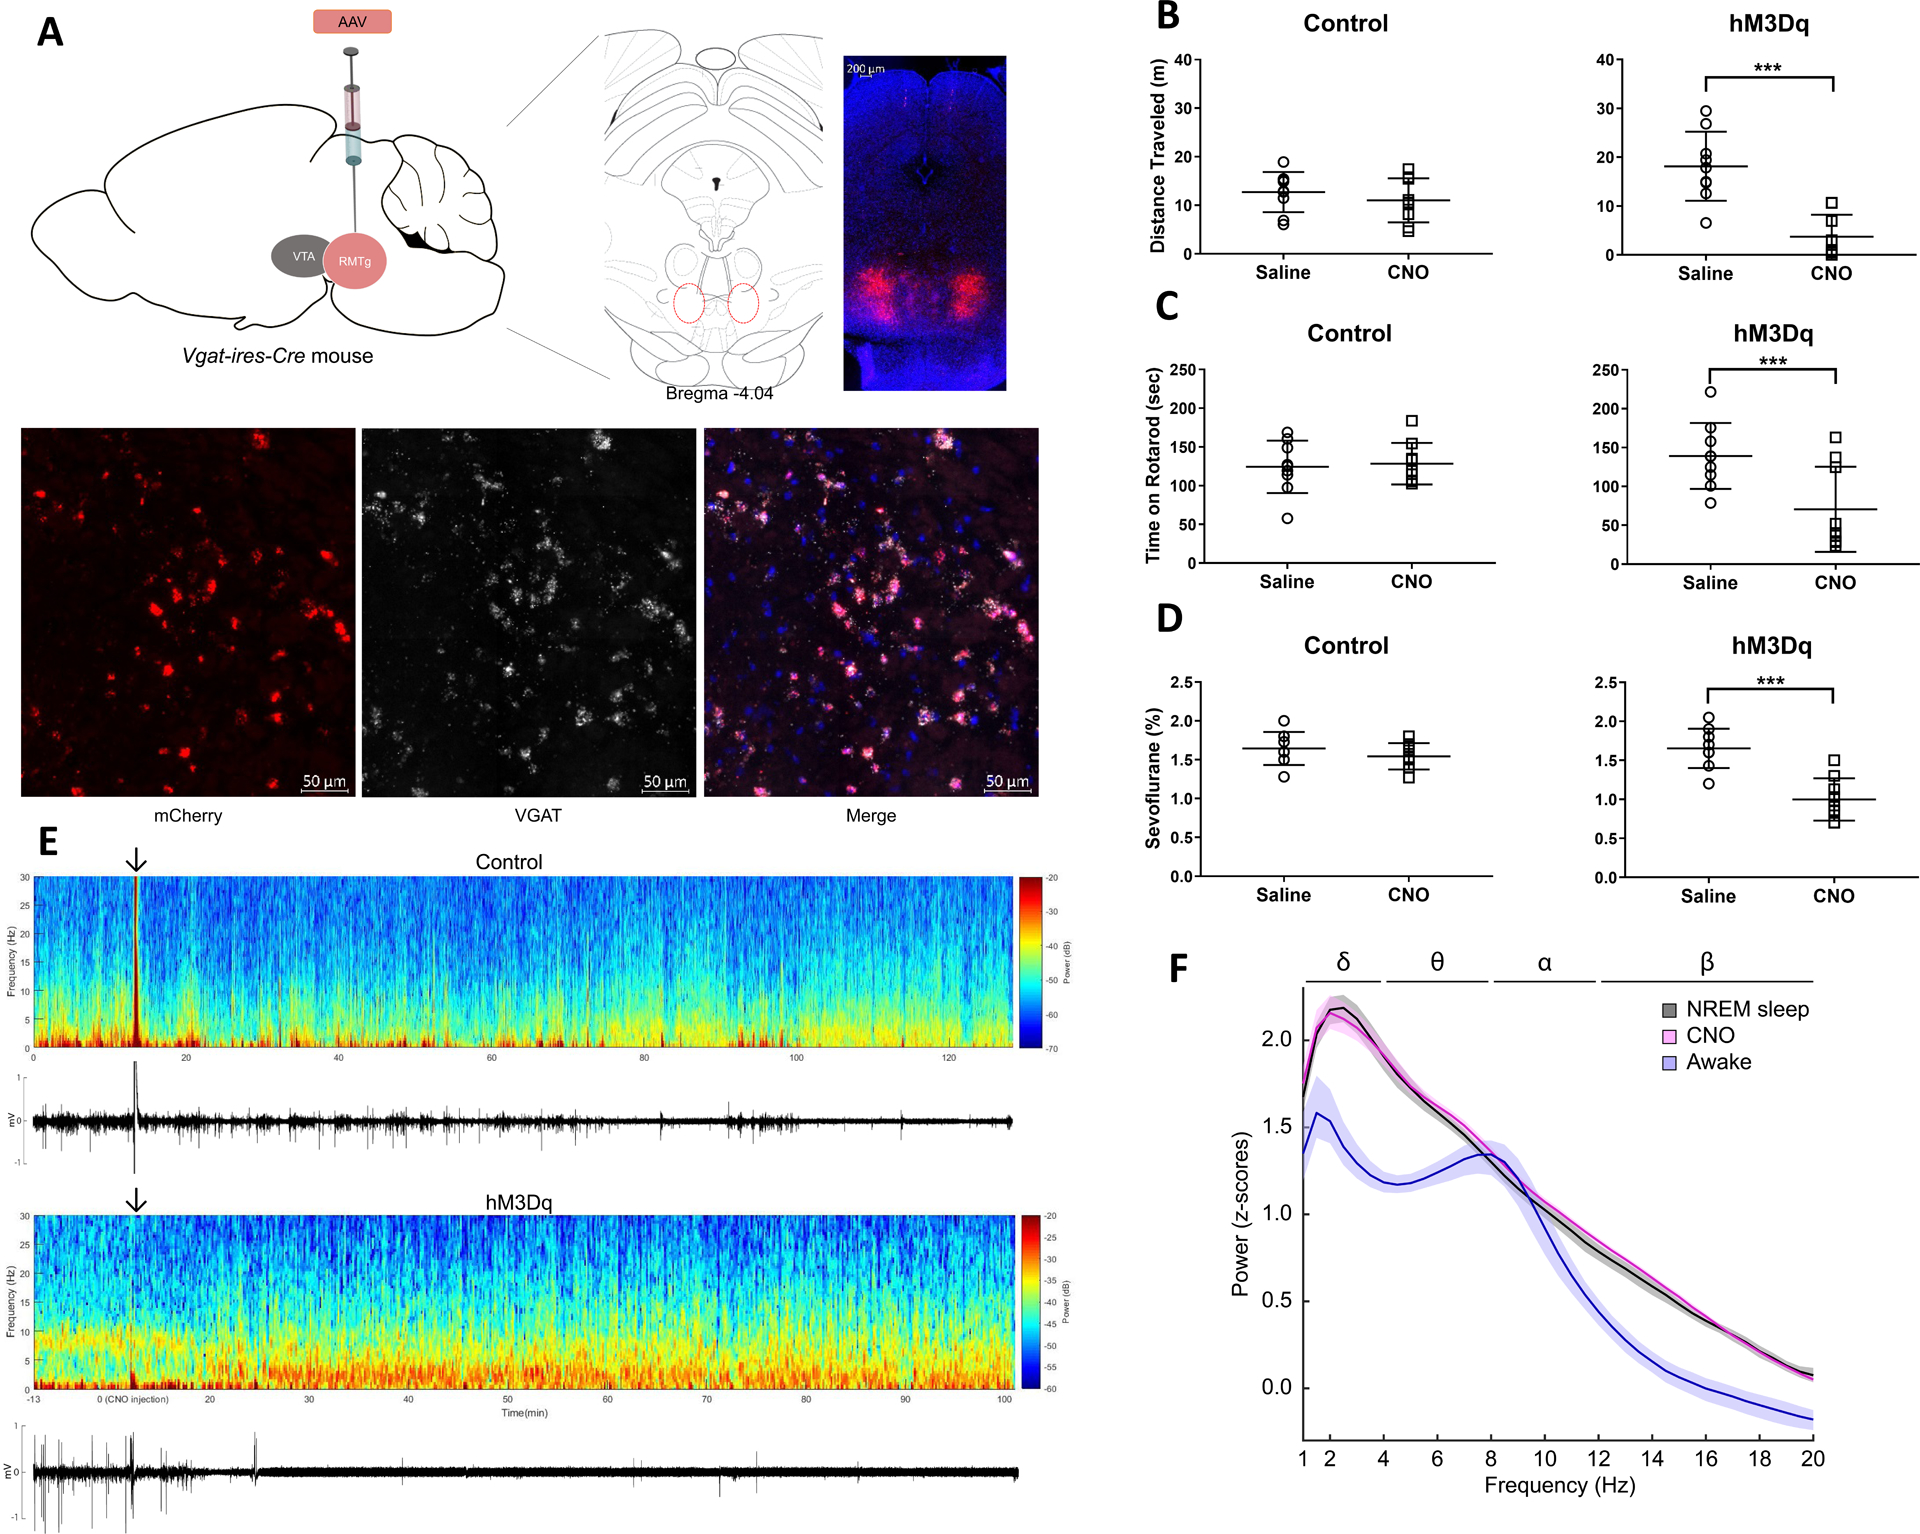
A. Bilateral expression of hM3Dq-mCherry in RMTg GABAergic neurons of Vgat-ires-Cre mice. Representative expression pattern of hM3Dq-mCherry in the RMTg (top). Co-localization of mCherry and VGAT (visualized with fluorescent in situ hybridization) demonstrates selective expression of hM3Dq in GABAergic neurons (bottom).
B. Activation of GABAergic neurons decreases the total distance traveled in the open field test. Scatter plots showing total distance traveled (meters) in the 5-minute open field test after i.p. administration of saline (vehicle) or CNO (1 mg/kg) for control and hM3Dq mice (lines represent mean and SD). Although there was no significant change in control mice after CNO, total distance traveled was significantly decreased in hM3Dq mice.
C. Activation of GABAergic neurons decreases the total time on an accelerating rotarod. Scatter plots showing total time (seconds) on the accelerating rotarod (lines represent mean and SD). CNO (1 mg/kg) significantly decreased total rotarod time in hM3Dq mice compared to saline, but there was no significant difference in control mice.
D. Activation of GABAergic neurons decreases the dose requirement for sevoflurane-induced unconsciousness. Scatter plots show that in control mice, CNO (1 mg/kg) had no significant effect on sensitivity to sevoflurane-induced loss of righting reflex (LORR) compared to saline (lines represent mean and SD). In hM3Dq mice, however, CNO significantly reduced the dose of sevoflurane required for LORR.
E. Activation of GABAergic neurons increases EEG spectral power at low frequencies and decreases EMG activity. Spectrogram of a continuous EEG recording from a representative control mouse before and after CNO injection (top). The arrow indicates the time of CNO administration. The animal remained awake and active, as demonstrated by low spectral power in the delta range (1–4 Hz), and high EMG activity. However, in a representative hM3Dq mouse, approximately 20 minutes after CNO, spectral power increased at low frequencies (1–4 Hz) and persisted for the duration of the recording. The corresponding EMG activity below the spectrogram shows that the increase in EEG delta power coincided with decreased movement.
F. Activation of GABAergic neurons produces an EEG power spectrum similar to NREM sleep. Group power spectral density estimates comparing EEG recordings taken during wakefulness, NREM sleep, and after CNO. The 95% bootstrapped confidence intervals are shown in the shaded areas. CNO (pink) induced a power spectrum very similar to NREM sleep (black) and distinct from the awake state (blue).
