
Figure 2: PRO mean change scores from baseline (T1) to 12 Months Post-treatment (T5) by SVR status.
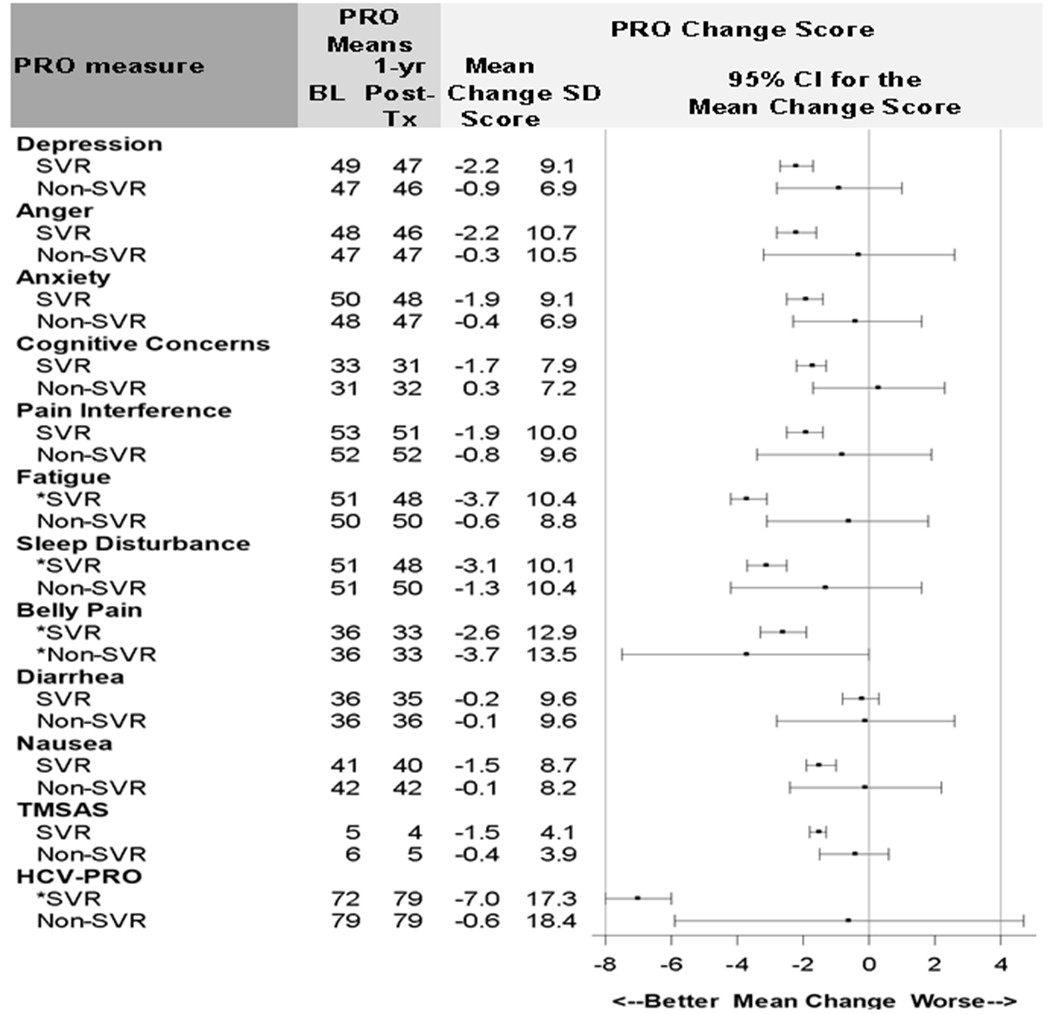
NOTE: * Mean change score greater than %5 MIC. The 5% MIC for PROMIS symptoms=2.5 points, for TMSAS=3.0, for HCV-PRO=4.0. SVR n=1,277; Non-SVR n=52. CI: confidence interval. HCV-PRO score is on 0-100 scale. HCV-PRO mean change score was reverse coded for consistency with other PROs. Negative change scores represent better outcomes. Missing values for all PRO change scores were ≤2%, except functional well-being (HCV-PRO) was missing for 6%-12% of patients.