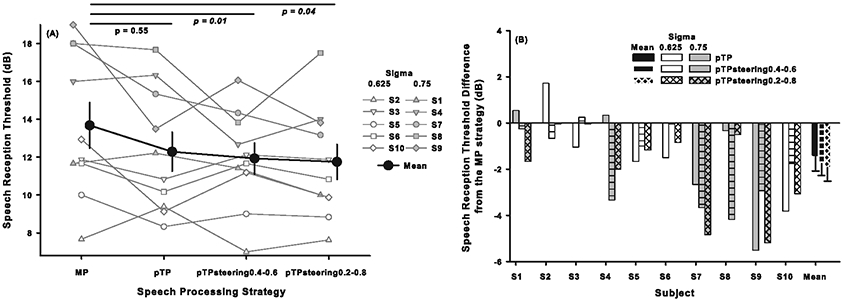
Figure 2:

(A) Speech reception thresholds (SRTs) for 50% correct keyword recognition in the Hearing in Noise Test for each experimental strategy. Black circles represent the mean while error bars represent the standard error across all subjects. White and gray symbols show the individual results with σ = 0.625 and 0.75, respectively. p values of post-hoc Bonferroni t-tests between the MP strategy and the pTP, pTPsteering0.4-0.6, and pTPsteering0.2-0.8 strategies are shown at the top, with italic p values indicating significant differences in SRT. (B) SRT differences between the MP strategy and the pTP (blank bars), pTPsteering0.4-0.6 (bars with horizontal lines), and pTPsteering0.2-0.8 strategies (bars with crossed lines). Black bars represent the mean while error bars show the standard error across all subjects. White and gray bars show the individual results with σ = 0.625 and 0.75, respectively. A few bars are hardly visible because the related SRT differences were close to 0 dB. Negative values indicate better pTP or pTPsteering results than MP results.
