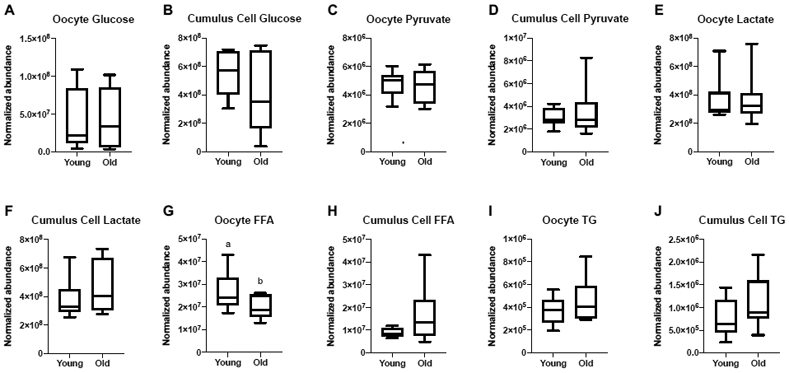
Figure 1. Relative abundance of metabolites in metaphase II oocytes and the respective cumulus cells from young and old mares.

Relative abundance of glucose in (A) oocytes and (B) cumulus cells, pyruvate in (C) oocytes and (D) cumulus cells, lactate in (E) oocytes and (F) cumulus cells, total free fatty acids (FFA) in (G) oocytes and (H) cumulus cells (P=0.08), and total triglycerides (TG) in (I) oocytes and (J) cumulus cells. Single samples were analyzed from Young (n=8 mares) and Old (n=10 mares). Box plots present median, first and third quartiles, with whiskers from minimum to maximum values. Different superscripts indicate differences at P < 0.05 (Student’s t test).
