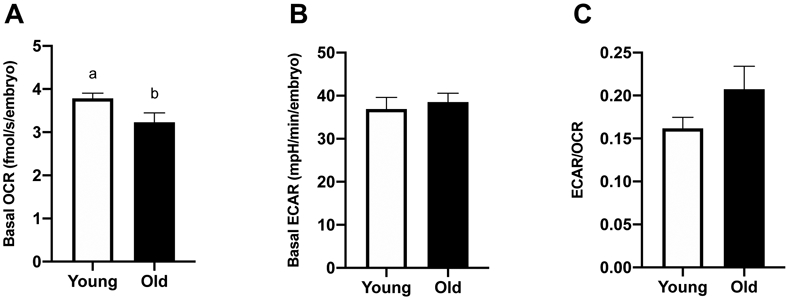
Figure 4. Metabolic function of in vitro-produced, day-2 embryos from young and old mares.

(A) Basal OCR (Young, n=8 from 7 mares; Old, n=10 from 8 mares), (B) basal ECAR (Young, n=7 from 7 mares; Old, n=3 from 3 mares) and (C) proportion of glycolytic rate over oxidative phosphorylation rate (Young, n=7 from 7 mares; Old, n=3 from 3 mares). Barcharts present mean ± SEM. Different superscripts indicate differences at P < 0.05 (Student’s t test).
