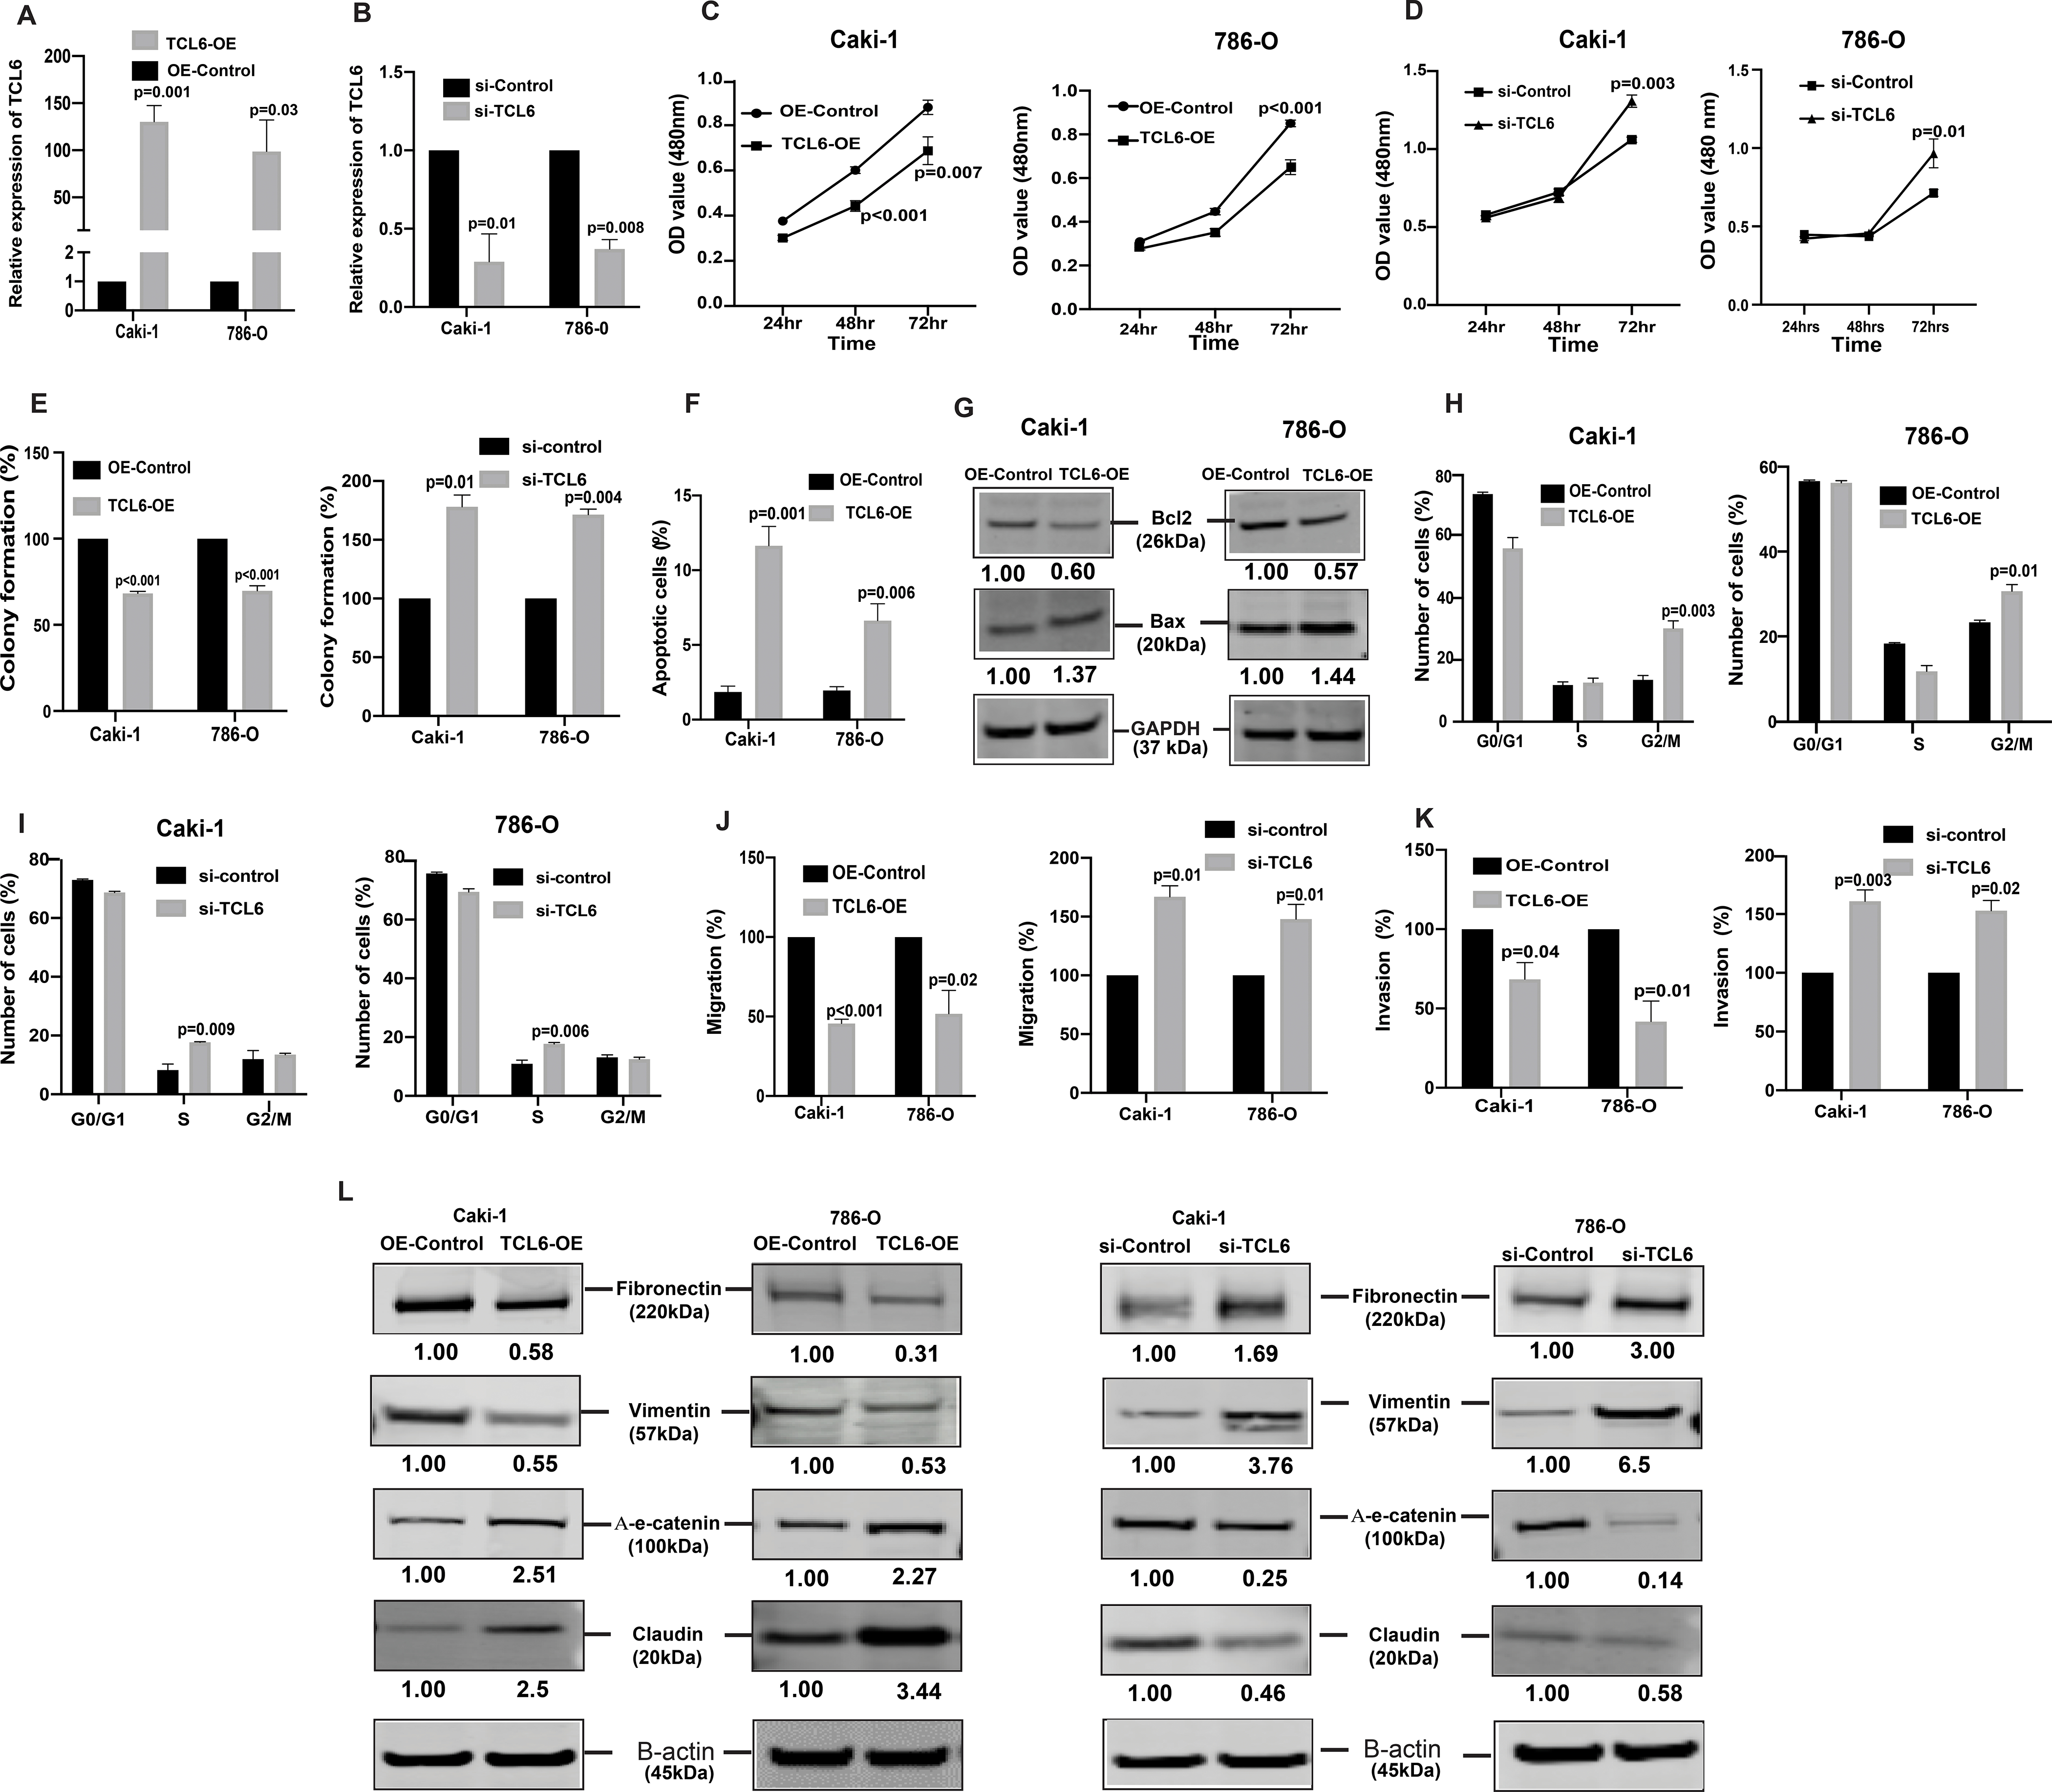
Figure 2. lncTCL6 is tumor suppressor with an anti-metastatic role in RCC.

To evaluate the functional significance of TCL6 in renal cancer, TCL6 gene was overexpressed in Caki-1/786-O cell lines by transfection followed by selection of cells stably overexpressing TCL6 stably (TCL6-OE). For comparison, cells transfected with control plasmid (OE-control) were used. Later these TCL6-OE cells were used to perform rescue experiments (A) Relative expression levels of TCL6 in stable TCL6-OE cells as compared to control cells. (B) Relative expression levels of TCL6 in cells transfected with siTCL6 as compared to control cells. (C) Proliferation of TCL6-OE stable Caki-1(left), 786-O(right) cells by MTS assay (D) Proliferation of TCL6 suppressed Caki-1(left), 786-O (right) cells by MTS assay (E) Colony formation assay (graphical representation) in TCL6-OE-stable cells (left) and cells transfected with siTCL6 compared to control cells (right). (F) Apoptosis assay represented as a graph to show total apoptosis (early +late) in stable TCL6-OE cells. (G) Immunoblots showing apoptotic proteins in TCL6-OE Caki-1 and 786-O cells compared to control cells with GAPDH as endogenous control. (H) Cell cycle analysis showing significant increase in G2/M phase in TCL6-OE Caki-1 and 786-O cells compared to control cells. (I) Cell cycle analysis showing significant increase in S phase in Caki-1 and 786-O cells with suppressed TCL6 expression compared to control cells. Transwell migration assays (J) and invasion assays (K) in TCL6-OE and si-TCL6 treated Caki-1 and 786-O cells as compared to their respective controls. (L) Immunoblot assay showing EMT related proteins in Caki-1 and 786-O cells stably expressing TCL6 and transient transfected siTCL6 as compared to control cells, B-actin as endogenous control. The numbers below the blot represent relative protein level, which was determined from band intensity using Image studio software of LI-COR and normalized relative to cells stably expressing control plasmid or treated with si-control.
Graphs are mean of three independent experiments (N=3). P value was calculated by Student t test. Bar = mean ± standard error mean (SEM).
