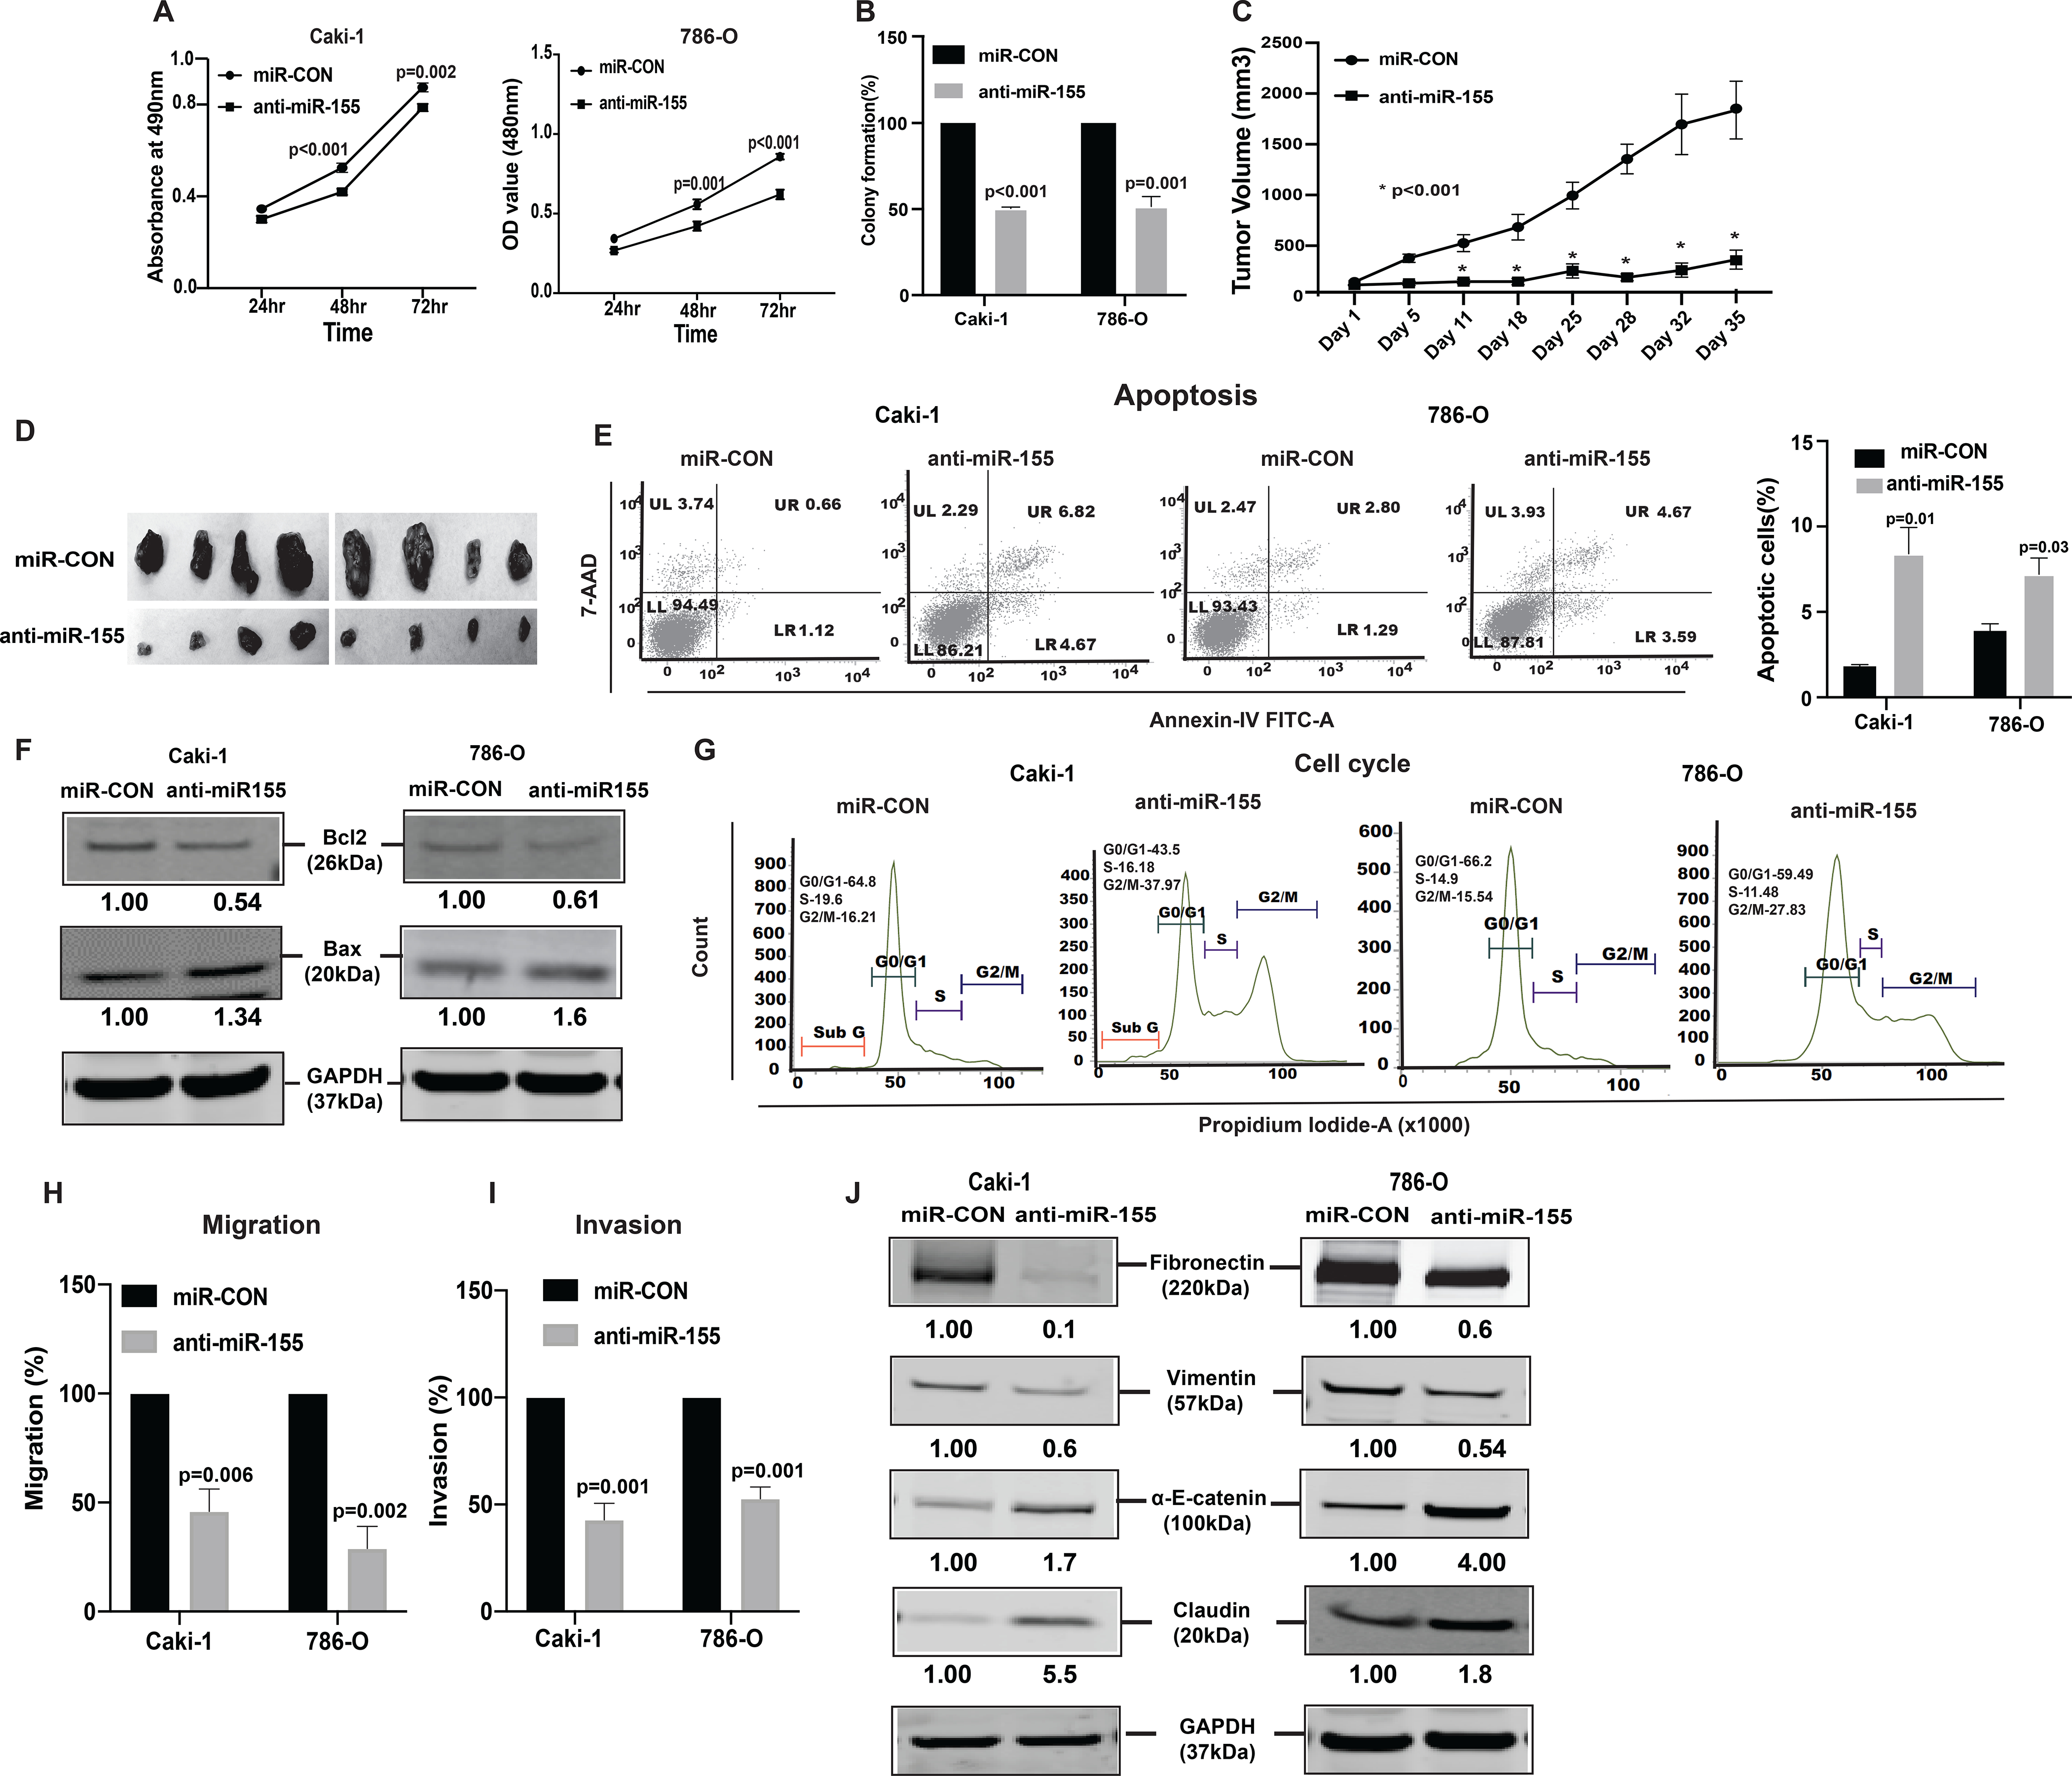
Figure 3. Knockdown of miR-155 functionally phenocopies the effect of lnRNATCL6 overexpression.

(A) Proliferation of anti-miR-155-stable Caki-1(left), 786-O(right) cells by MTS assay. (B) Colony formation assay (graphical representation) in anti-miR-155-stable Caki-1 and 786-O cells compared to controls. (C) Tumor volumes of xenograft tumors from mice injected with anti-miR-155-stable Caki-1 cells and control cells at indicated time points. Data represent the mean of each group ± SE. (D) Images of extracted tumors from miR-CON and anti-miR-155-stable groups at Day 35 are shown. (E) FACS apoptosis analyses of anti-miR-155-stable Caki-1 and 786-O cells compared to control. Graph represents total apoptosis (early + late). (F) Immunoblots showing apoptotic proteins in anti-miR-155-stable Caki-1 and 786-O cells compared to control cells with GAPDH as endogenous control. (G) Cell cycle analysis showing significant increase in G2-M phase of anti-miR-155-stable Caki-1 and 786-O cells. Caki-1 and 786-O cells stably expressing anti-miR-155 were subjected to transwell assay to evaluate chemotactic migration (H) and invasion (I) as seen in graphical representation for both Caki-1 and 786-O cells. (J) Immunoblot assay showing EMT related proteins in Caki-1 and 786-O cells stably expressing anti-miR-155 plasmid as compared to control cells, GAPDH as endogenous control. The numbers below the blot represent relative protein level, which was determined from band intensity using Image studio software of LI-COR and normalized relative to cells stably expressing control plasmid Graphs are mean of three independent experiments, (N=3). P value was calculated by Student t test. Bar = mean ± standard error mean (SEM).
