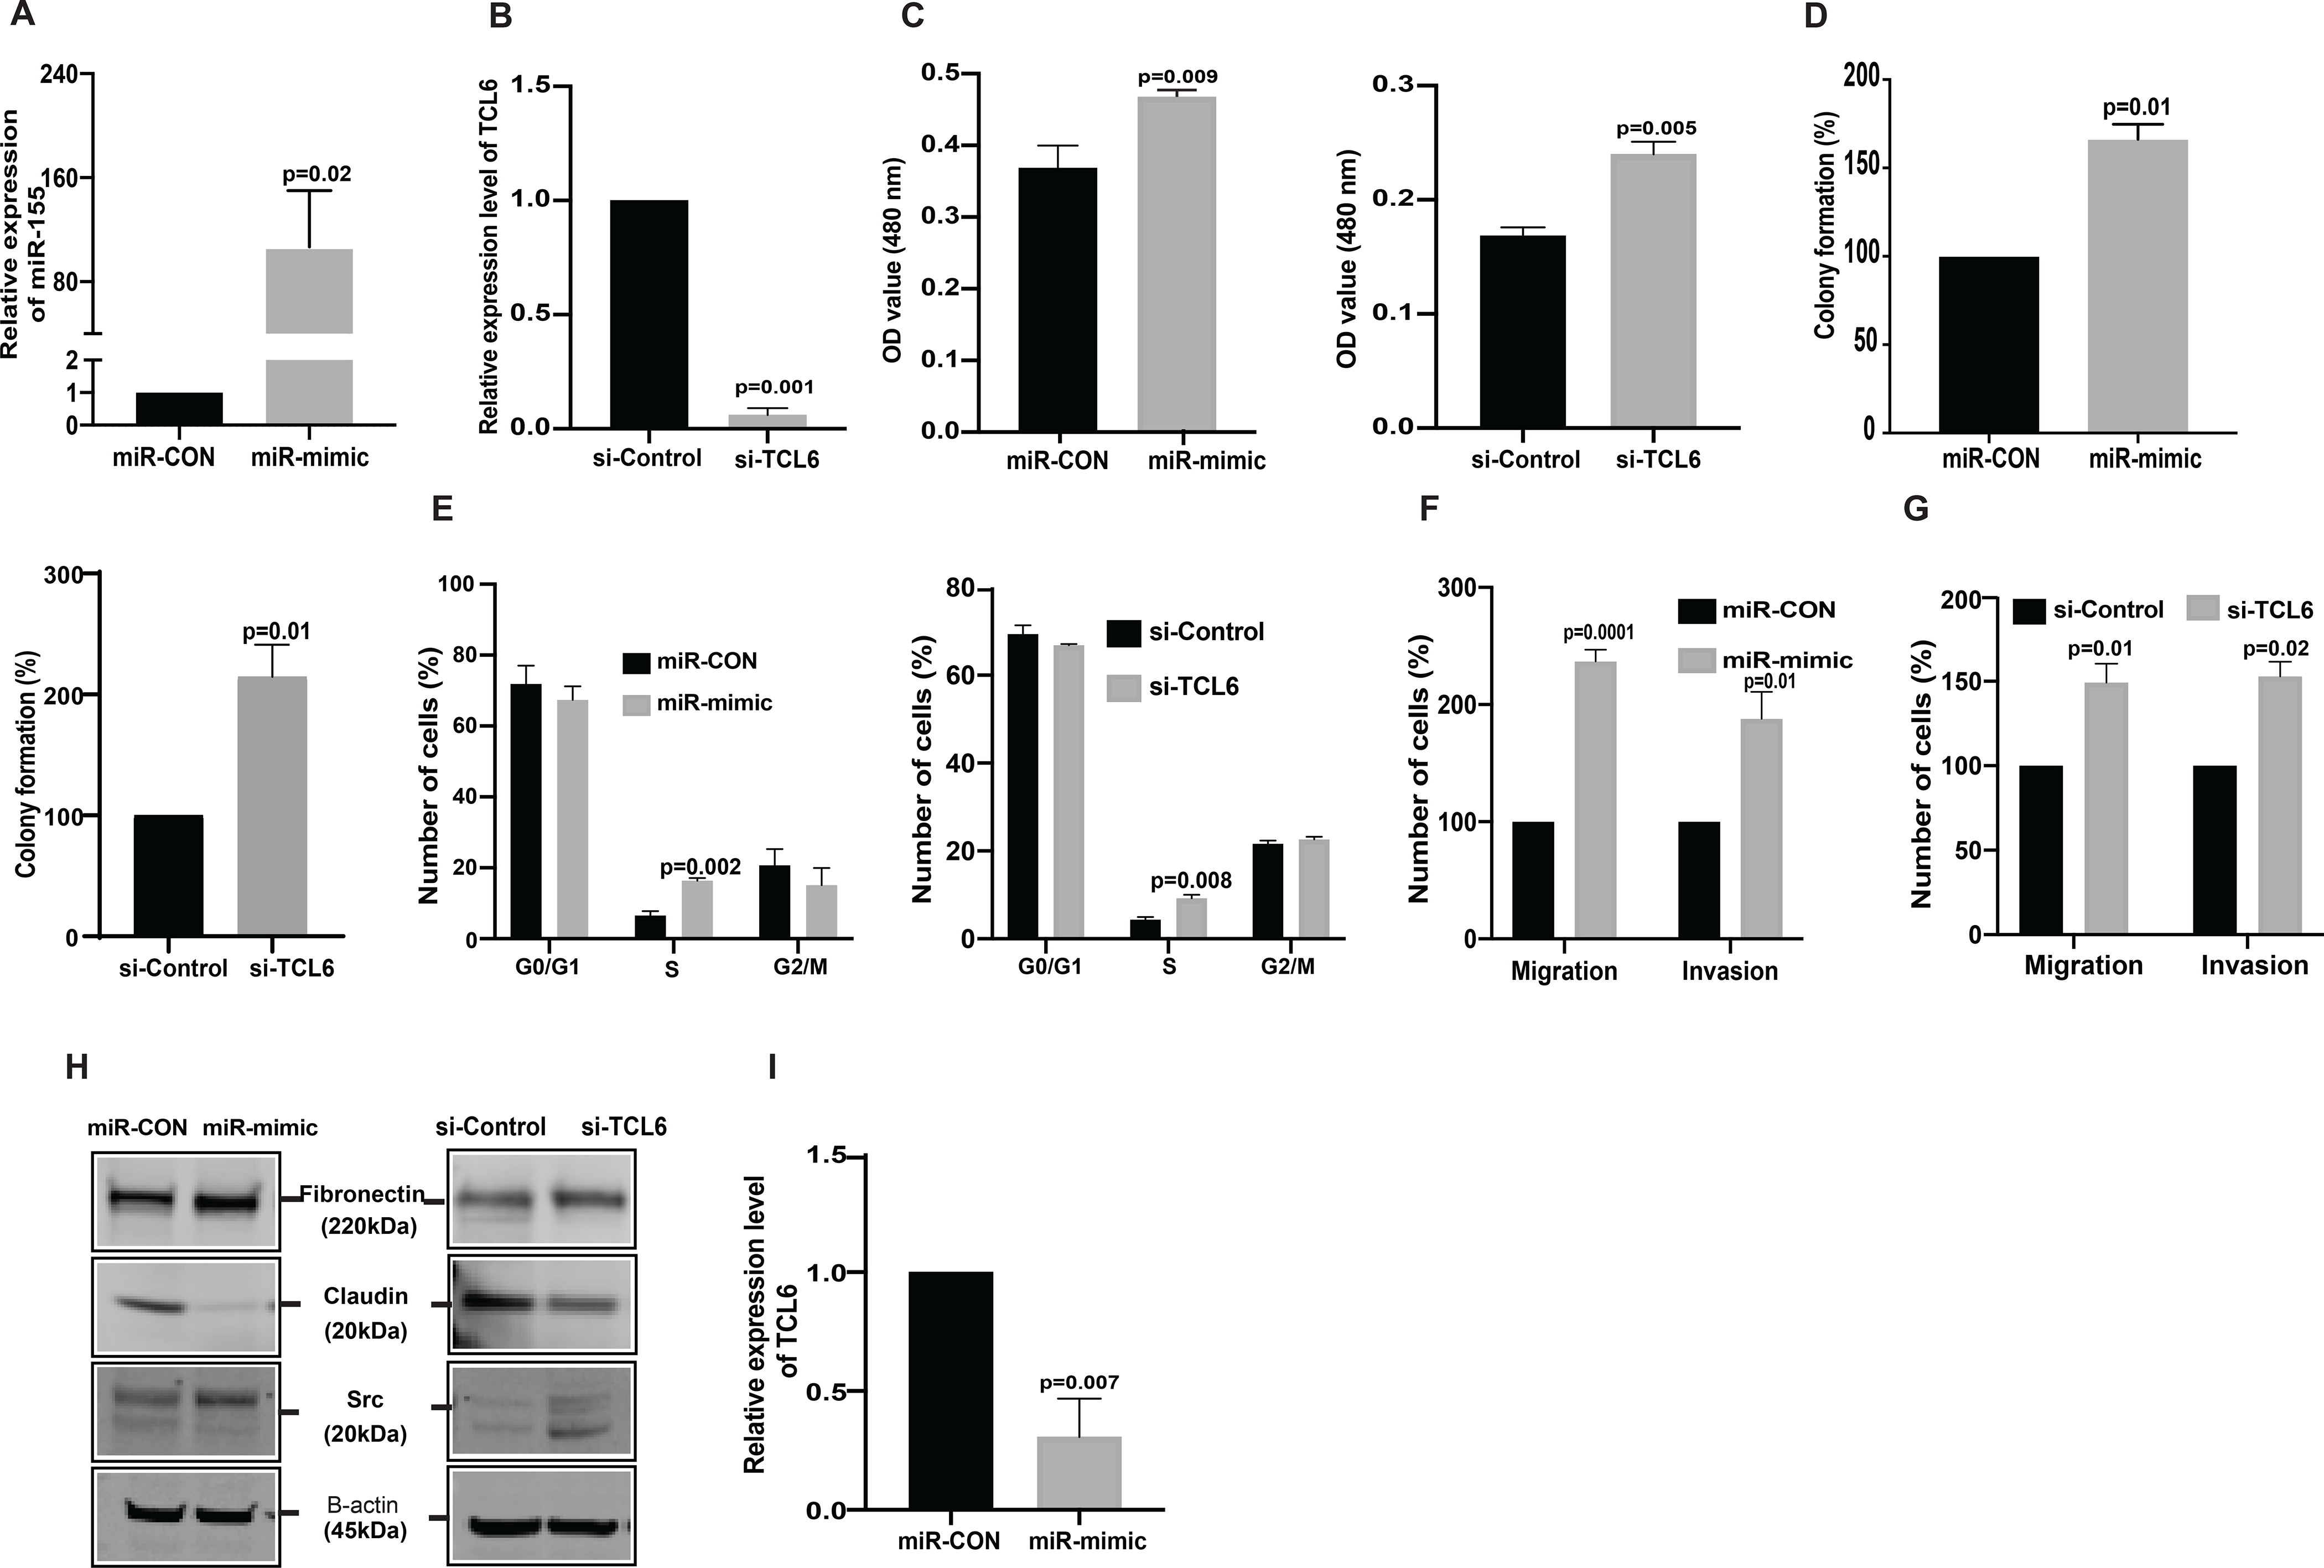
Figure 4. miR-155 overexpression and TCL6 suppression increases invasiveness and proliferation of normal immortalized renal epithelial cell line, HK2.

HK2 was treated with miRVANA miR-155 mimic /control mimic (miR-CON) as well as si-TCL6 and corresponding control followed by functional assays (performed 72 hours post-transfection). (A) Relative miR-155 expression as assessed by real-time PCR. (B) Relative expression of TCL6 cells treated with siTCL6 (C) Cell viability in HK2 cells after miR-CON/miR-155 mimic transfections and after si-control/si-TCL6 transfections as assessed by MTS assay at 72 hr time-point. (D) Colony formation assay shows increase in clonogenicity of HK2 cells post miR-155 overexpression and post TCL6 suppression as compared to control (E) Cell cycle analysis showing significant increase in S-phase for the HK2 cells transfected with miR-155 mimic as well as the HK2 cells transfected with si-TCL6 as compared to cells transfected with control (F) Transwell migration assays and invasion assays in miR-CON/miR-155 mimic transfected cells (G) Transwell migration assays and invasion assays in si-Control/si-TCL6 transfected cells (H) Relative expression of EMT markers (Fibronectin, Claudin, Src) in miR-155 overexpressing and TCL6 suppressed HK2 cells as compared to control cells. (I) TCL6 expression in miR-155 overexpressing HK2 cells as compared to control cells.
The bar graph (mean ± standard error mean (SEM) represent the data from three technical replicates,N=3 P value was calculated by Student t test.
