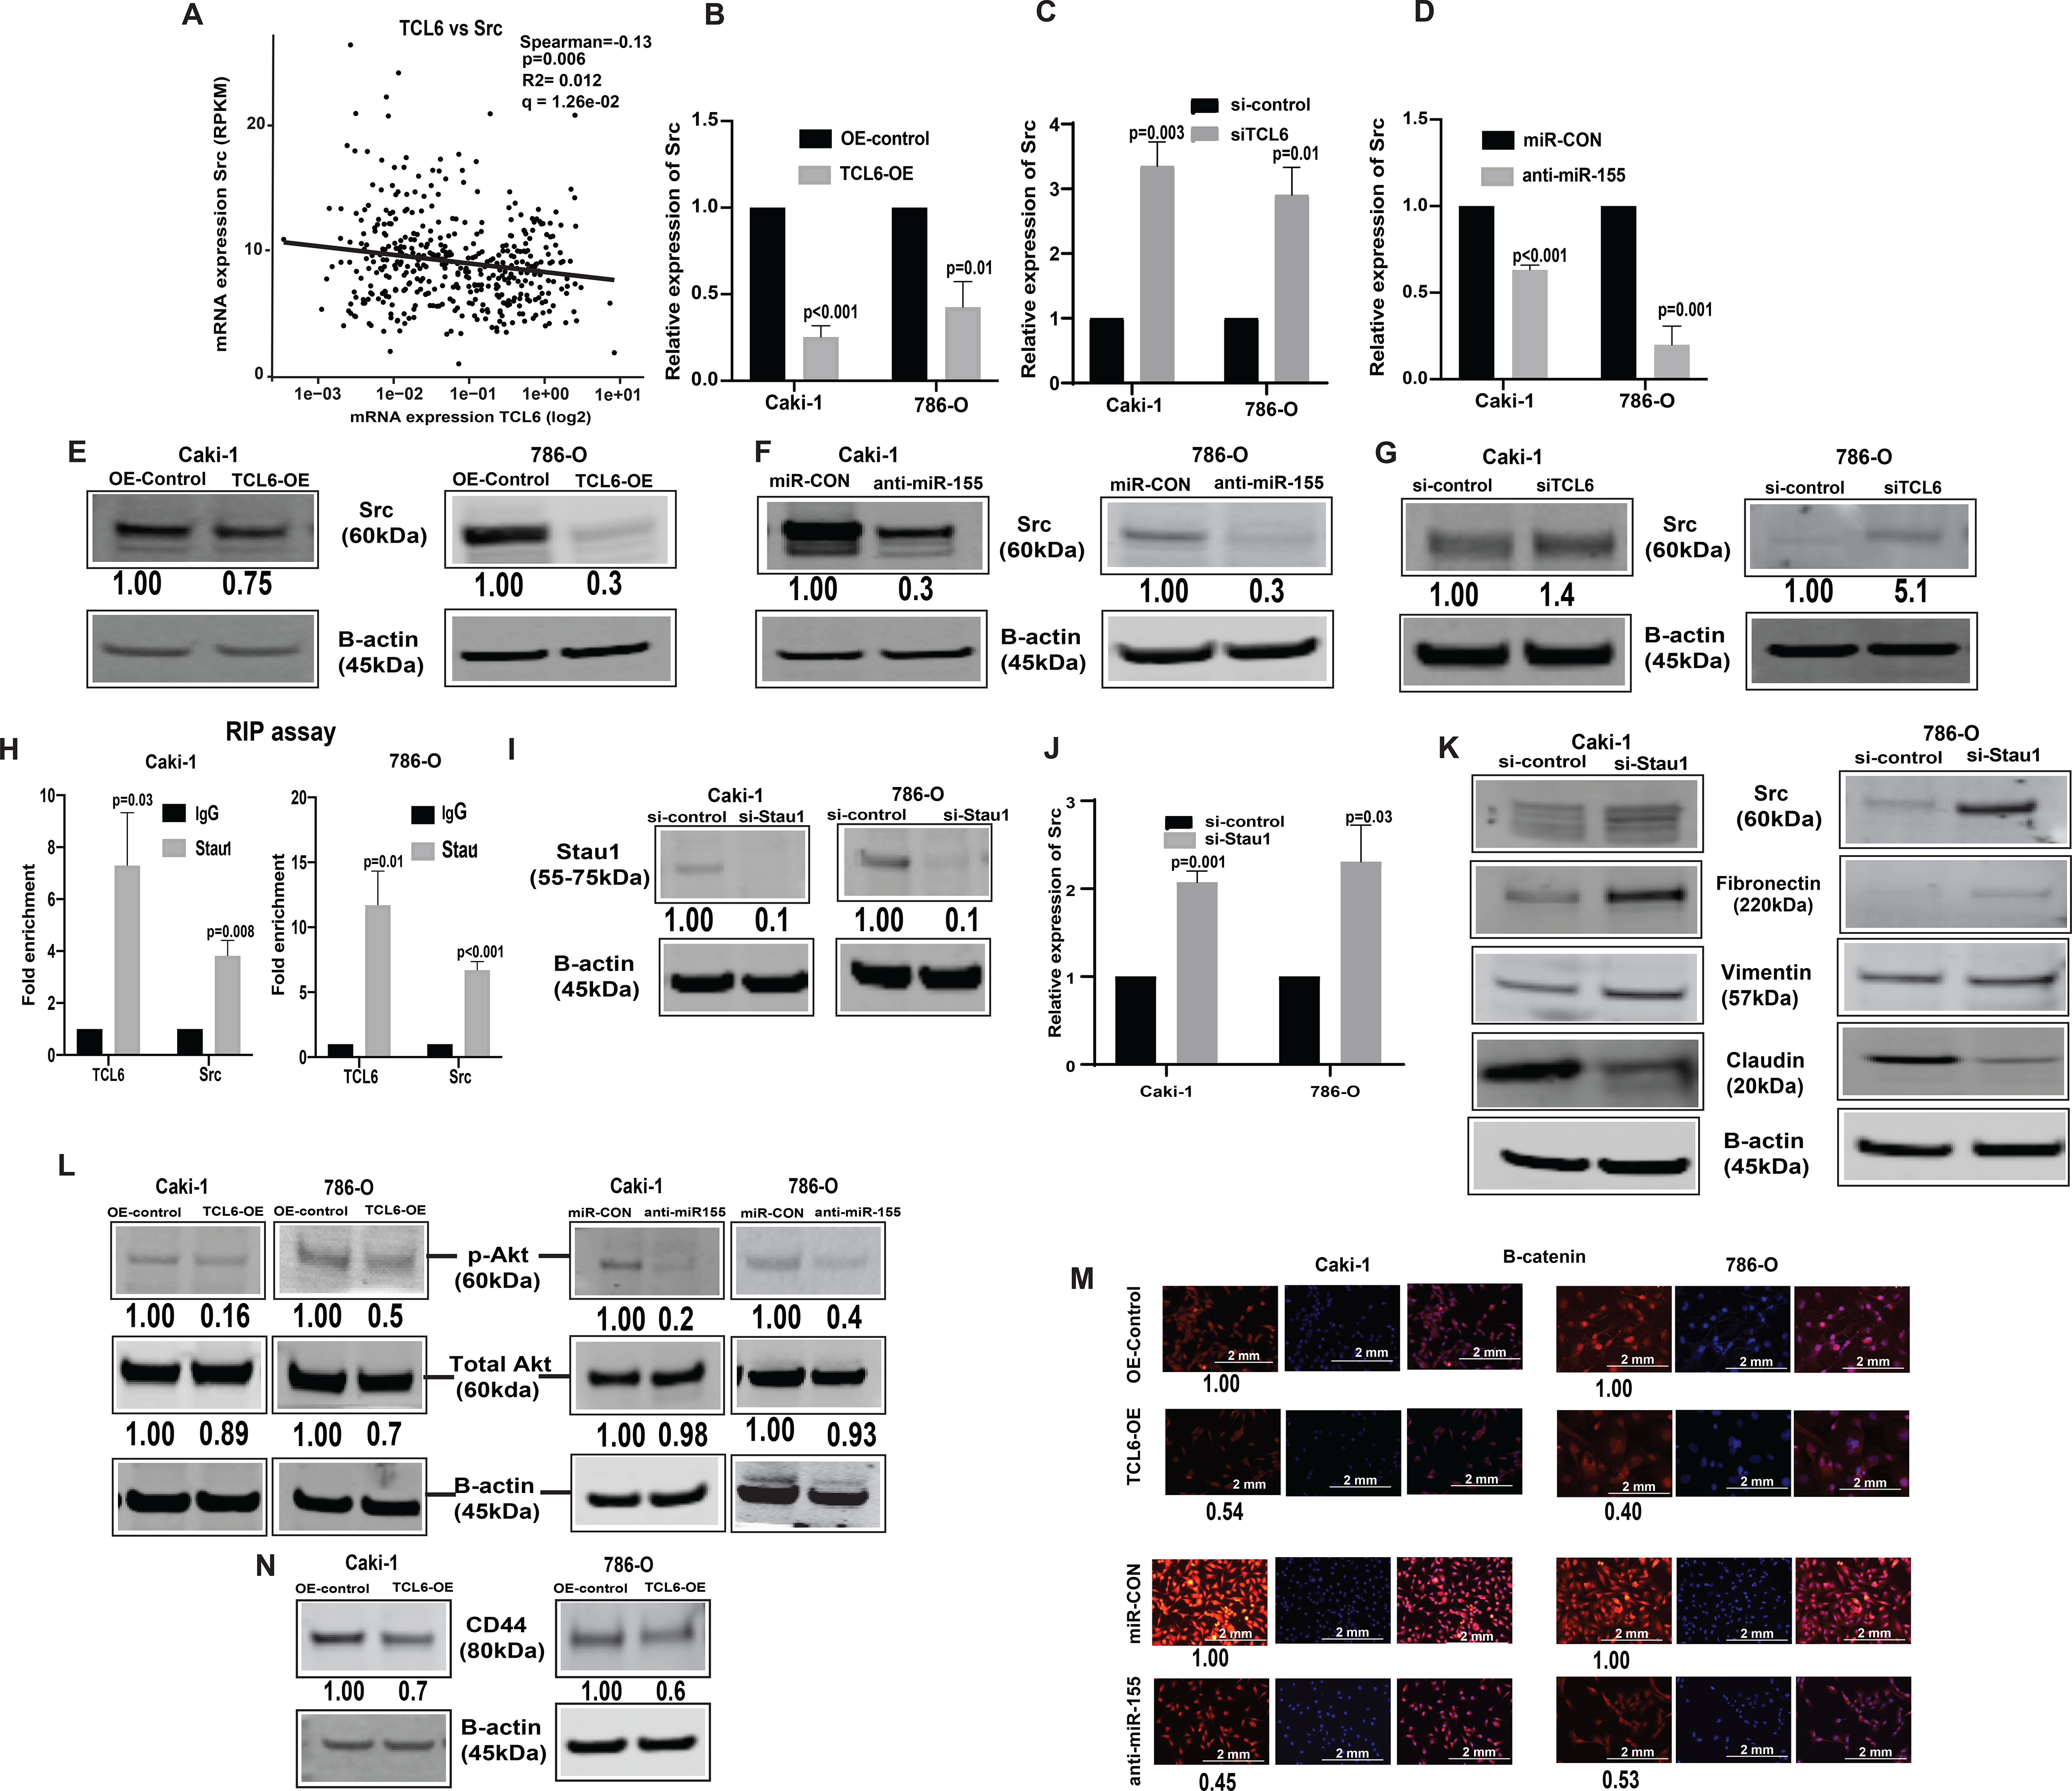
Figure 5. LncTCL6 degrades Src mRNA by STAU1 mediated RNA degradation, and thereby attenuates Src-Akt mediated EMT transition in renal carcinoma.

(A) Negative correlation between TCL6 and Src expression in KIRC-TCGA dataset. Spearman test was used to analyze the correlation. Relative expression of Src (mRNA) in cells with TCL6 overexpression (B), in TCL6-OE cells transfected with si-TCL6 (C) and in cells with stable miR-155 inhibition (D) as compared to their respective control cells. Immunoblot of Src in Caki-1 and 786-O cells stably overexpressing TCL6 (E), cells expressing anti-miR-155 and (F) cells transfected with si-TCL6 (G) as compared to respective control cells. (H) RNA-immunoprecipitation using STAU1 antibody shows enrichment of TCL6 and Src as compared to control antibody (IgG) in TCL6 over-expressing cells. (I) STAU1 expression in TCL6-OE cells transfected with siSTAU. (J) Src mRNA expression in TCL6-OE cells transfected with siSTAU (K) Immunoblot showing expression of Src and EMT markers (Fibronectin, Vimentin, Claudin) in TCL6-OE cells transfected with siSTAU (L) Immunoblot showing suppression of phosphorylated Akt in cells stably expressing TCL6 and anti-miR-155 as compared to respective controls. (M) Immunostaining of p-®-catenin (red) counterstained with DAPI (blue) in Caki-1 and 786-O cells expressing anti-miR-155 stably and overexpressing TCL6 as compared to respective control cells, scale bar: 2mm (right bottom). (N) Immunoblot showing suppression of metastatic marker CD44 in cells stably expressing TCL6 as compared to respective controls. The numbers below the blot represent relative protein level, which was determined from band intensity using Image studio software of LI-COR and normalized relative to cells stably expressing control plasmid or treated with si-control.
The bar graphs represent mean ± standard error mean (SEM) from three set of experiments, (N=3). P value was calculated by Student t test. Immunoblot and immunofluorescence staining was performed for three and two biological replicates respectively..
