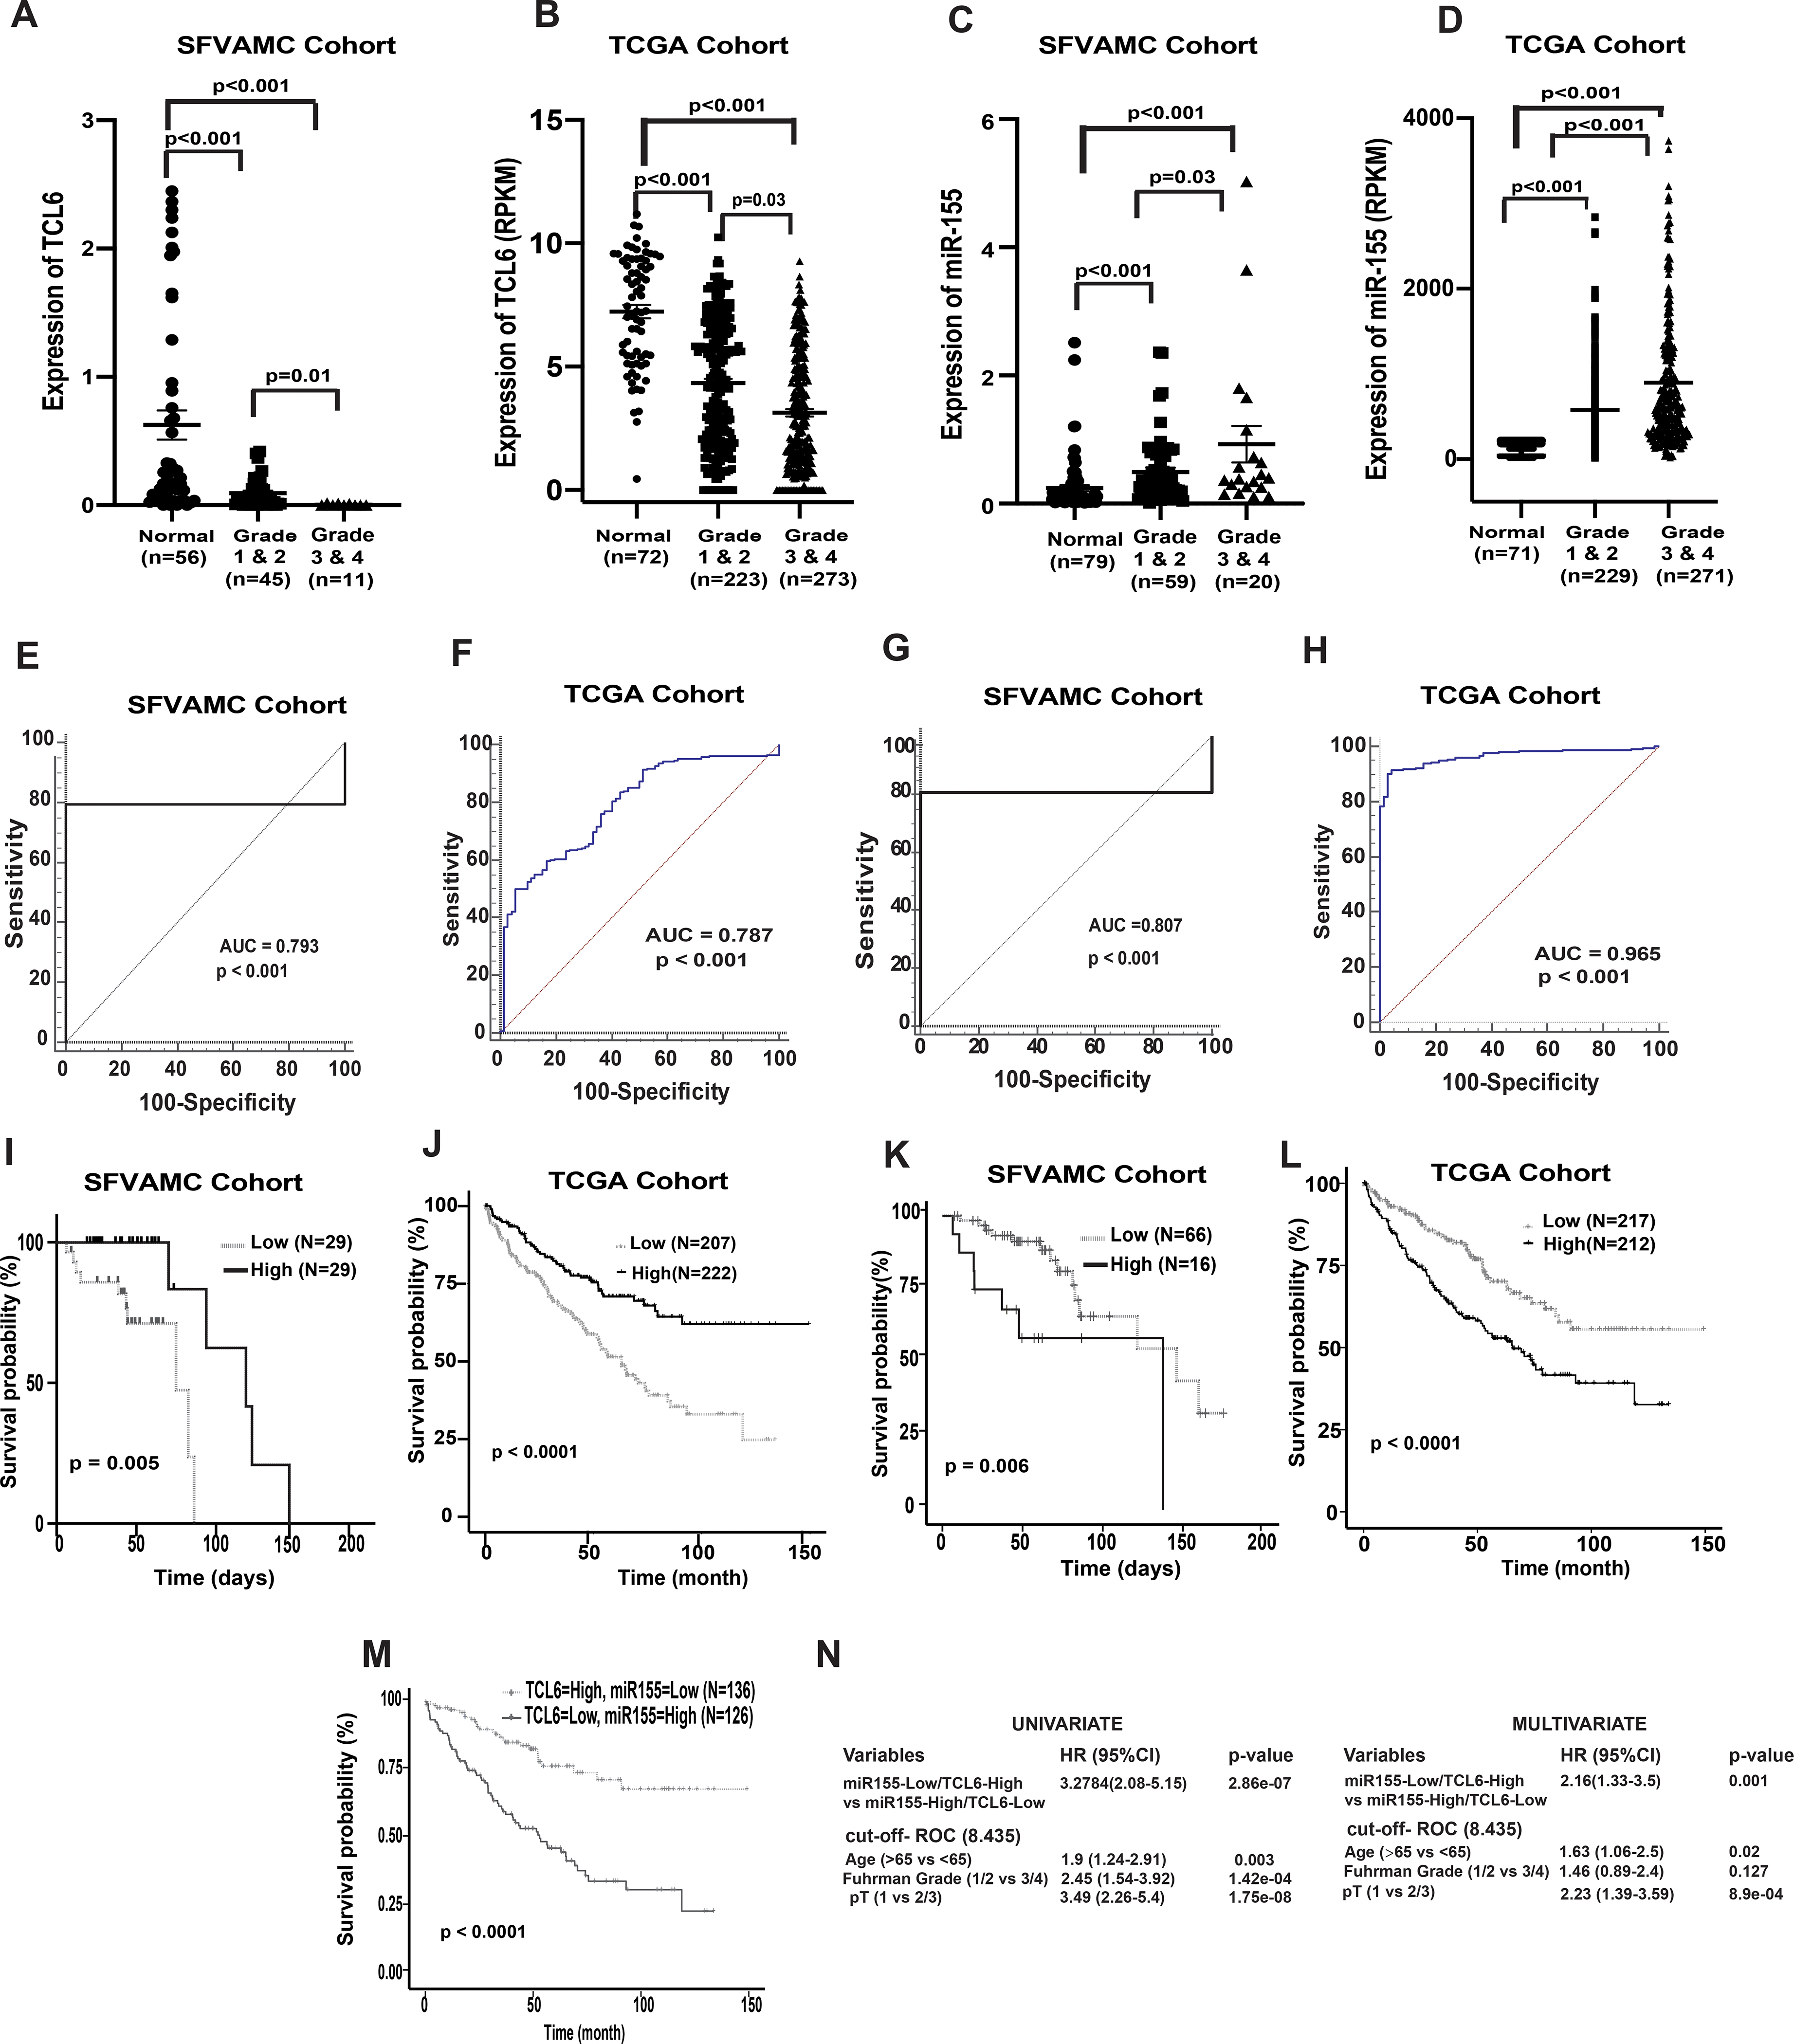
Figure 6. Clinical significance of lncTCL6 and miR-155 in RCC.

(A) Expression levels of lnc TCL6 across different grades in SFVAMC cohort [normal (n=56), grade 1 & 2 (n=45) and grade 3 & 4 (n=11)], p value calculated by Mann-Whitney test. (B) Expression levels of lncTCL6 across different grades in KIRC-TCGA cohort [normal (n= 72), grade 1 & 2 (n=223) and grade 3 & 4 (n=273)], p value calculated by Mann-Whitney test. (C) Expression levels of miR-155 among different grades in SFVAMC cohort [normal (n=79), grade 1 & 2 (n=59) and grade 3 & 4 (n=20)], p value calculated by Mann-Whitney test. (D) Expression levels of miR-155 among different grades in KIRC-TCGA cohort [normal (n= 71), grade 1 & 2 (n=229) and grade 3 & 4 (n=271)], p value calculated by Mann-Whitney test. (E) Receiver operating curve (ROC) analysis showing ability of lncTCL6 to differentiate between malignant and non-malignant SFVAMC samples. (F) Receiver operating curve (ROC) analysis showing ability of lncTCL6 to differentiate between malignant and non-malignant TCGA samples. (G) Receiver operating curve (ROC) analysis showing ability of miR-155 to differentiate between malignant and non-malignant SFVAMC samples. (H) Receiver operating curve (ROC) analysis showing ability of miR-155 to differentiate between malignant and non-malignant TCGA samples. (I) Overall survival of renal cancer patients (SFVAMC cohort) with high lncTCL6 expression (n=29) compared to low expression (n=29) performed by Kaplan- Meier analysis, p-value calculated by log-rank test. (J) Overall survival of renal cancer patients (KIRC TCGA cohort) with high lncTCL6 expression (n=222) compared to low expression (n=207) performed by Kaplan- Meier analysis, p-value calculated by log-rank test. (K) Overall survival of renal cancer patients (SFVAMC cohort) with high miR-155 expression (n=16) compared to low miR155 expression (n=66) performed by Kaplan- Meier analysis, p-value calculated by log-rank test. (L) Overall survival of renal cancer patients (KIRC TCGA cohort) with high miR-155 expression (n=253) compared to low miR155 expression (n=253) performed by Kaplan- Meier analysis, p-value calculated by log-rank test. (M) Overall survival of renal cancer patients (KIRC TCGA cohort) with high miR-155 and low TCL6 expression (n=126) compared to low miR155 and high TCL6 expression (n=136) performed by Kaplan- Meier analysis, p-value calculated by log-rank test. (N) Logistic regression model showing high TCL6 and low miR-155 expression could be a unique risk factor for patient survival.
