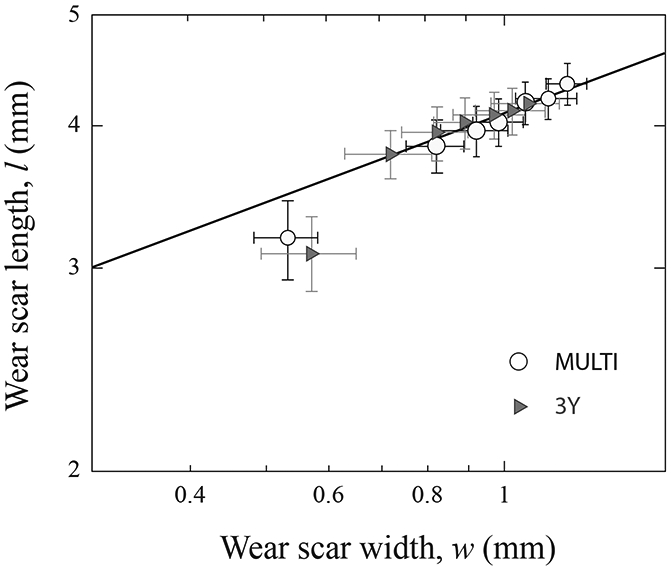
Figure 4.

Plot of wear scar length l versus width w. Measurements were made following each predetermined sliding cycles in Fig. 3. Data are presented in mean and standard error of the mean. Solid line is simply a best fit through the steady state data sets.
