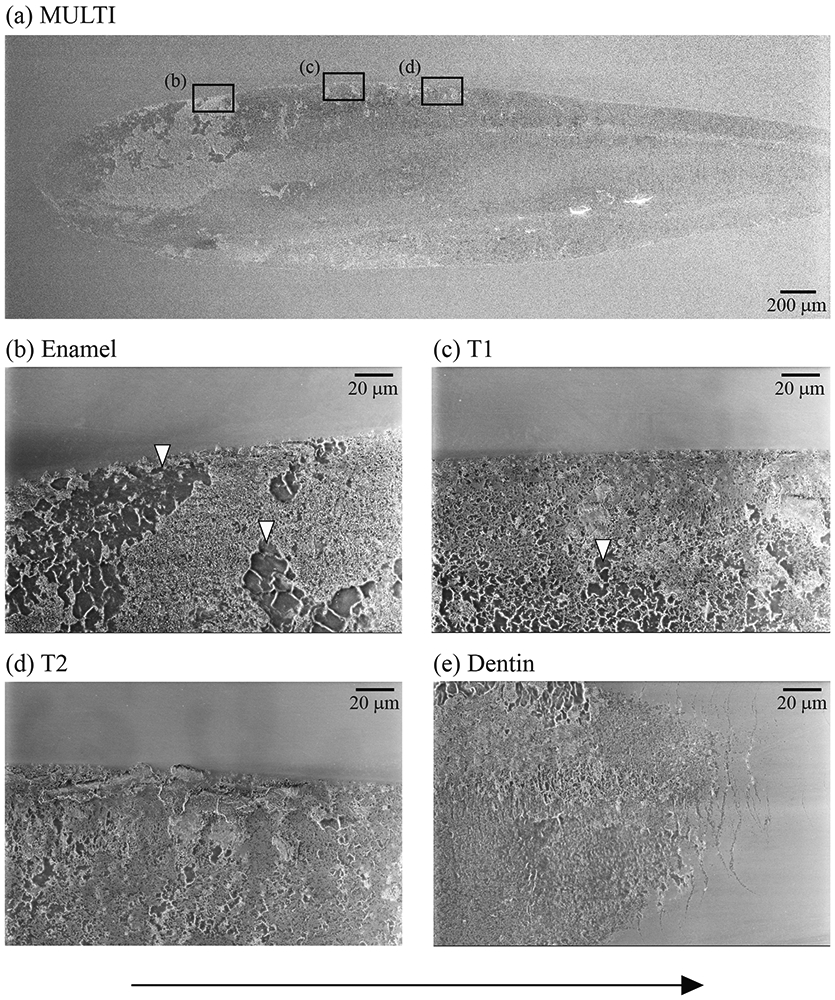
Figure 6.

(a) The representative SEM image of the wear scar of a MULTI specimen after 500,000 cycles of oral-wear simulation. Images (b) to (e) are higher magnification views of the wear surface of each layer of MULTI material. White arrows point to areas of grains dislodgement. Cracks are located ahead of the wear scar, as shown in image (e). The sliding direction of the antagonist is from left to right (black arrow).
