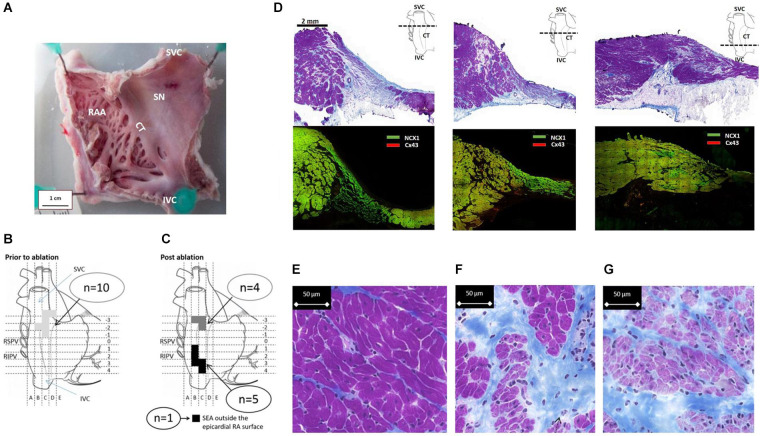
FIGURE 1.
Functional evaluation of the SAP region and the SAN in goats. (A) Fresh preparation of the posterior wall of the right atrium (RA) from a control goat. CT, crista terminalis; SAN, sinus node; IVC, inferior vena cava; SVC, superior vena cava. Schematic diagrams (B,C) depict the locations of the site of earliest activation during mapping and ablation experiments. (B) Location of the site of earliest activation (SEA) prior to ablation (n = 10) is represented by the shaded area (light gray). (C) After ablation, the shaded squares correspond to regions of the RA where each individual SEA shifted to. Two well-separated areas are defined: one cluster is close to the IVC/RA junction (black), while the second cluster remained close to the RA/SVC junction (dark gray); n = 6 are shown; one SEA was outside the accessible epicardial RA surface and is therefore presumed to be either on the interatrial septum or left atrium. (D) Cross-sections of the SAN and PNA, taken perpendicular to the CT at the levels displayed by the dashed line in the schematic. The top row shows Masson’s trichrome (connective tissue stains royal blue, the cytoplasm pink, and the nuclei dark blue). The area of the SAN is identifiable by its pale appearance. The SAN occupies the full thickness of the intercaval region in the superior sections. The PNA appears as a loosely packed bundle, which is localized between the SAN and the working atrial myocardium. The bottom panels in panel (D) shows adjacent sections double labeled for NCX1 protein (green) and Cx43 protein (red); SAN tissue is characterized by the presence of NCX1 but the absence of Cx43 and thus appears bight green on these images due to the absence of red signal from Cx43. Regions of nodal tissue can be identified in all sections including the most inferior part of tissue. (E–G) High-magnification images of Masson’s trichrome-stained atrium (E), PNA (F), and SAN (G). The SAN cells are smaller, paler (stained purple), and embedded in a rich connective tissue (royal blue) compared to the atrial myocardial cells.

