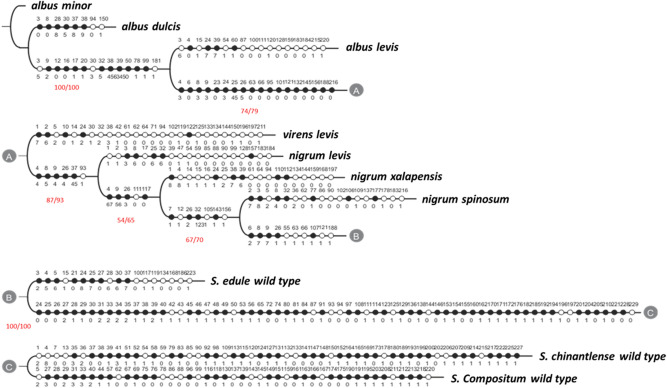
Figure 1.
Cladogram of ten genotype of three Sechium spp. based on morphological, biochemical, genetic, and biological activity characters on malignant cell lines to identify the character/genotype. White dots represent apomorphic variation and black dots plesiomorphic. The numbers on the higher and lower parts of the cladogram branch represent the character and the state in which it varies. The values separated by the diagonal line represent the Bootstrap/Jackknife indexes, with L = 566, Ci = 59 and Ri = 51.

