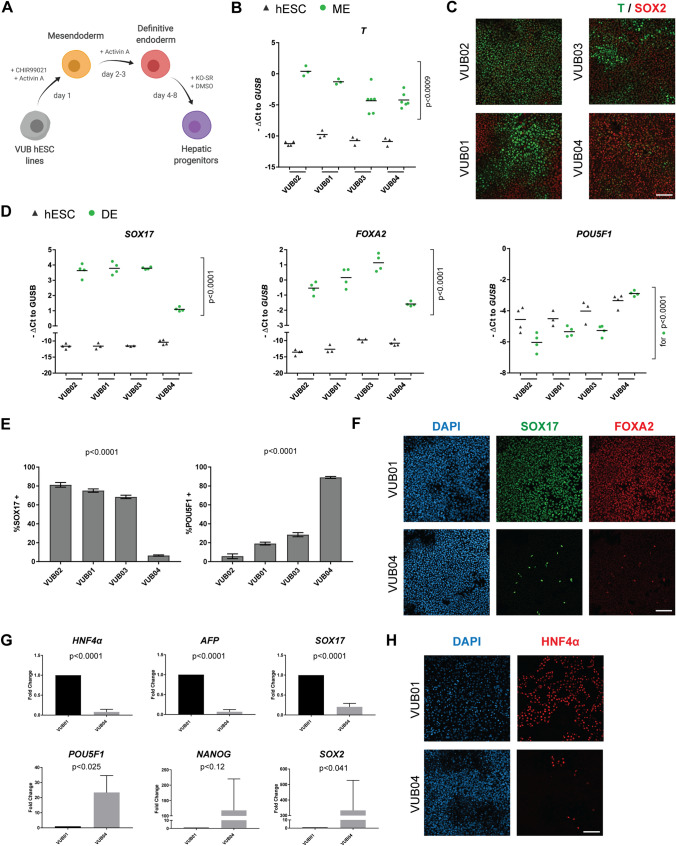
Figure 1.
Differentiation propensity screen of four hESC lines shows that the VUB04 line has a low differentiation efficiency towards definitive endoderm (DE). (A) Schematic overview of differentiation protocols used to direct the cells towards mesendoderm (ME), DE and hepatic progenitors (HP). Created with BioRender. (B) Gene expression levels of T in hESCs and ME samples. Black triangles and green dots represent undifferentiated and differentiated samples, respectively. (C) Representative immunofluorescent images for T and SOX2 after 24-h ME differentiation. (D) Expression level of SOX17, FOXA2 and POU5F1 in hESCs and DE samples. Black triangles and green dots represent undifferentiated and differentiated samples, respectively. (E) Percentage of SOX17- and POU5F1-positive cells after 72-h DE differentiation of hESC lines. The cells were counted with ImageJ software, version 1.51j8 (https://imagej.nih.gov/ij/index.html). (F) Representative immunofluorescent images for SOX17 and FOXA2 after DE differentiation of VUB01 and VUB04. (G) Comparison of expression levels of hepatic, DE and pluripotency markers between VUB01 and VUB04 in HP samples. (H) Representative immunostainings for HNF4α after 8-day HP differentiation of VUB01 and VUB04. All scale bars represent 100 μm. All gene expression data and the quantified immunofluorescent data are representative of at least three (panel B,D) or three (panel G) biological replicates. The p-values were calculated using either one-way ANOVA (panel B,D,E) or unpaired t-test (panel G). For panels B and D, the p-values were calculated only for differentiated samples (green dots).

