Figure 3.
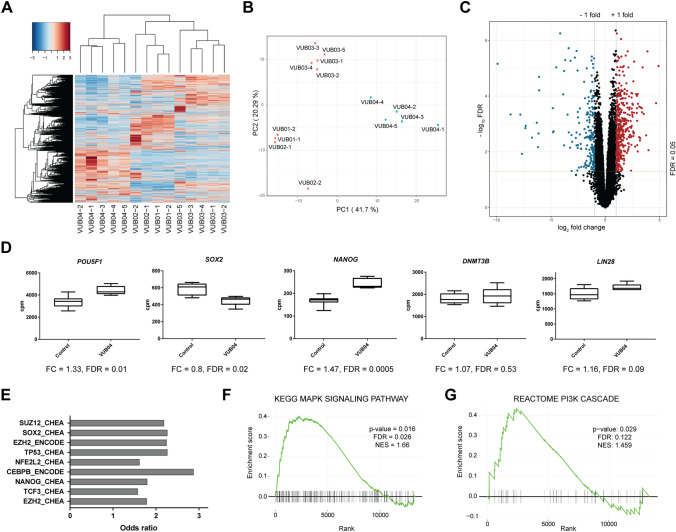
Transcriptomic analysis reveals that VUB04 has a distinct expression profile at the undifferentiated stage. (A) Unsupervised hierarchical clustering and heatmap of transcriptome data of all lines tested. (B) Principal Component Analysis of dimension 1 versus dimension 2 based on normalized transcriptome data. (C) Volcano plot based on a comparison of gene expression levels between VUB04 and the control group (VUB01, VUB02 and VUB03). Genes with |log2 fold change|> 1 and FDR < 0.05 were marked as either significantly upregulated (red) or downregulated (blue). D) Normalized expression values for selected pluripotency markers in the control group and VUB04. FC fold change. (E) Transcription factor enrichment for the top deregulated genes in VUB04 (based on top |log2 fold change| and FDR < 0.05) done by the Enrichr tool and based on CHEA and ENCODE databases.) (F) and (G) Enrichment profile for MAPK/ERK signalling (F) and PI3K signalling (G) performed on the ranked gene list based on a comparison of the expression levels between VUB04 and the control group. Rank 0 represents the gene with the highest-ranking score. Vertical black bars represent genes within the ranked list belonging to the given pathway. NES normalized enrichment score.

