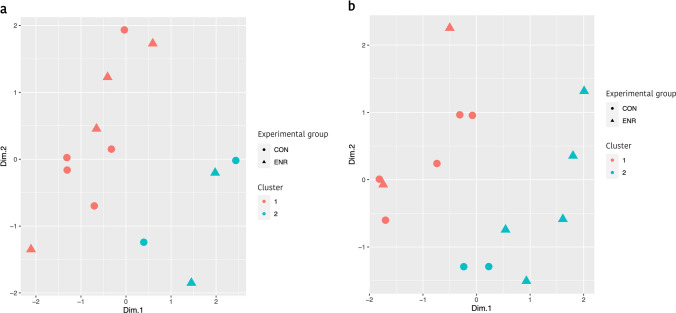
Figure 3.
Scatterplot of cluster stratification according to LinkHD blind analysis. a The clustering of the samples during lactation, whereas b shows the clustering of the samples after weaning. A similar cluster distribution was observed with the hierarchical grouping dendrogram by using the UPGMA (average method) based on Bray–Curtis distances and relative OTU counts (Fig. 1). Figures created by using open-source software R v3.5.3. (https://www.r-project.org/foundation/).

