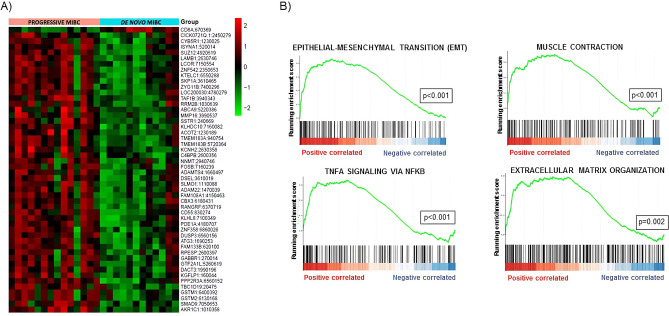
Figure 2.
Gene expression profiles in progressive and de novo MIBC samples. (A) Heat map displaying the 50 most differently expressed genes between progressive and de novo MIBC samples. Red pixels correspond to an increased abundance of mRNA in the samples, whereas green pixels indicate decreased mRNA levels. Rows represent genes and columns represent experimental samples. (B) Gene set enrichment analysis (GSEA) shows positive correlation of overexpressed genes in pathways involved in tumor progression.

