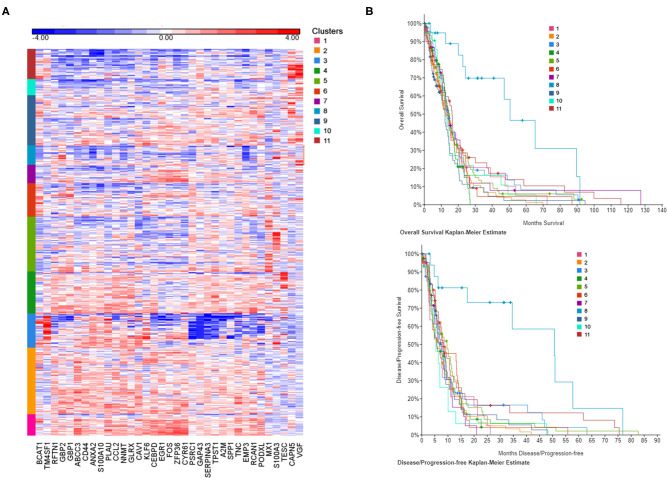
Figure 3.
CSF-induced gene signature influence survival in GBM patients. (A) The heat map represents each expression component. Each row represents a patient sample and each column a gene selected for a CSF-induced signature in GBM in vitro. For each patient, red indicates upregulation, blue indicates downregulation. Clusters (1–11) are color coded and represent gene-specific expression patterns. (B) Overall survival and disease/progression free Kaplan-Meier plots for the clusters derived by CSF-induced gene expression show a distinct cluster (8) with significant better clinical features.

