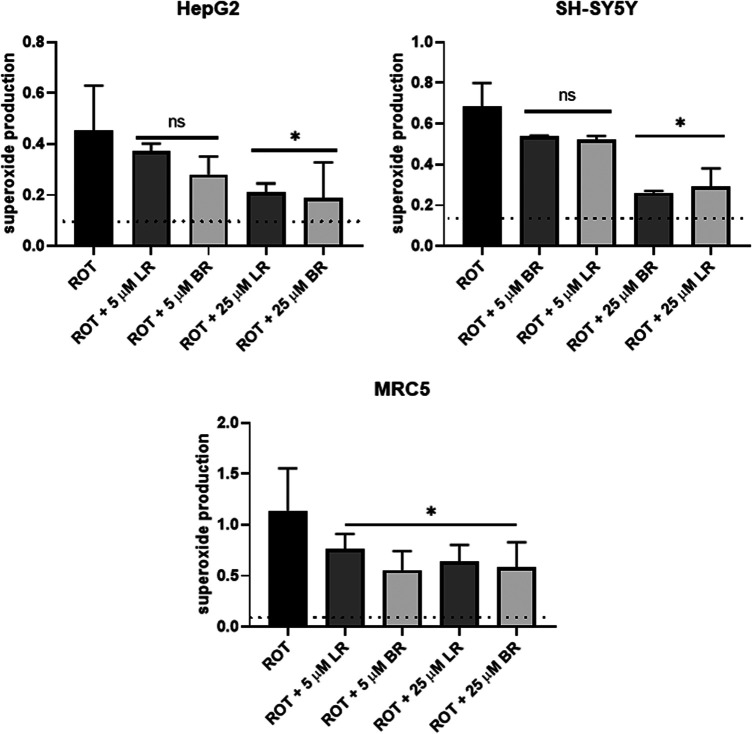
FIGURE 5.
The effect of LR and BR on superoxide production. Superoxide production was determined by flow cytometry in live cells after overnight LR and BR treatment (5 and 25 μmol/L) from the detected slope. Rotenone (ROT) was used as a positive control of superoxide generation. Basal superoxide production (dashed lines) was detected in the cells without ROT treatment. *, p < 0.05; ns, not significant compared to ROT, n = 4 for each experiment CTRL, control cells without LR and BR treatment; BR, bilirubin; LR, lumirubin. Data expressed as the change in proportion of superoxide-producing cells upon various treatments.

