Figure 3.
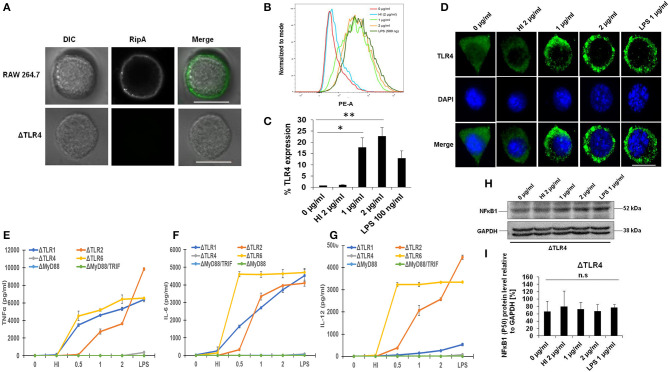
RipA induces enhanced expression of toll-like receptor (TLR)4 in treated macrophage cells. (A) RAW264.7 and ΔTLR4 cells were treated with purified RipA (2 μg/ml). After 2 h of treatment, cells were fixed with 4% formaldehyde to freeze the interaction of RipA to the cell surface localized receptor. Cells were washed and probed with polyclonal anti-RipA antibody (1:500) for 2 h. After treatment with primary antibody, cells were probed with anti-rabbit A488 conjugated secondary antibody, mounted on ProLong Anti Fade Glass mountant, and visualized using Carl Zeiss fluorescence microscope. Scale bar indicates 10 μm. (B) FACS analysis was used to study the expression level of TLR4 on RipA-treated macrophage cells. Monoclonal anti-TLR4 antibody conjugated to PE fluorophore was used in the FACS experiment. (C) The quantification of TLR4 expression is shown as a bar graph. Data are representative of 3 independent experiments (3 replicates per experiment) and quantification plot expressed as means ± SD. *P < 0.05 and **P < 0.01 vs. controls. (D) Immunofluorescence microscopic images showing membrane organization and expression of TLR4 in RipA treated macrophage cells. The anti-rabbit TLR4 monoclonal antibody was used to probe the localization of TLR4. A488 conjugated secondary antibody was used for signal generation. DAPI was used to mark the positions of the nucleus. Untreated and heat-inactivated (HI) treated cells were used as negative controls. LPS treated cells were used as a positive control. Scale bar indicates 10 μm. Mouse macrophage knockout cells ΔTLR1, ΔTLR4, ΔTLR2, ΔTLR6, ΔMyd88, and ΔMyd88/TRIF were treated with RipA (0.5, 1, and 2 μg/ml). LPS 1 μg/ml and HI RipA (2 μg/ml) were treated with proteinase K (PK; 50 mg/ml), followed by heat inactivation at 100°C for 4 h served as controls. After 24 h of treatment, cell culture supernatants were collected and TNF-α, IL-6, and IL-12 levels were measured by sandwich ELISA. (E–G) TNF-α, IL-6, and IL-12 secretion by macrophages derived from ΔTLR1, ΔTLR4, ΔTLR2, ΔTLR6, ΔMyd88, and ΔMyd88/TRIF mice knockout cell lines after 24 h of treatment as measured by ELISA (H,I). Western blot showing the level of NFkB and its densitometric quantification in ΔTLR4 cells. Data are representative of 3 independent experiments (3 replicates per experiment) and expressed as means ± SD. *p < 0.05 and **p < 0.01 vs. controls.

