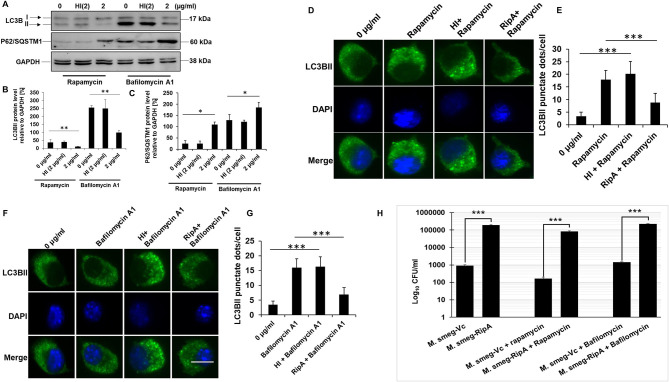
Figure 6.
RipA inhibits autophagy initiation in RAW264.7 cells. (A) Western blots showing the levels of autophagy markers LC3BII and P62 in RAW264.7 cells treated with RipA in the presence of rapamycin (200 nM) and bafilomycin A1 (50 nM). Untreated and HI treated cells were used as negative controls. GAPDH was used as loading control. (B,C) Densitometric quantifications of LC3BII and P62 bands are shown relative to GAPDH [%] as bar graphs. (D) Immunofluorescence microscopic images demonstrating the LC3 foci in untreated, Rapamycin (200 nM) treated, HI + Rapamycin treated, and RipA + Rapamycin treated RAW264.7 cells. DAPI was used to stain the nucleus. Untreated and rapamycin-treated cells were used as negative and positive controls. (E) The average number of LC3 foci were counted and represented as a bar graph. (F) Immunofluorescence microscopic images showing the LC3 foci in untreated, HI treated, and RipA-treated RAW264.7 cells in the presence of bafilomycin A1 (50 nM). Untreated and bafilomycin A1 treated cells were used as negative and positive controls. (G) The average number of LC3 foci were counted and represented as a bar graph. (H) RAW264.7 cells were infected with recombinant M. smegmatis containing RipA or vector alone harboring plasmids (MOI-1:10) for 24 h in the presence of rapamycin (200 nm) and bafilomycin A1 (50 nm) or without drug. Colony-forming unit (CFU) of vector alone and RipA transformed recombinant M. smegmatis were determined after 24 h of infection and represented as Log10 CFU/ml. Data are representative of 3 independent experiments and expressed as means ± SD. *p < 0.05, **p < 0.01 and***p < 0.001 vs. controls.

