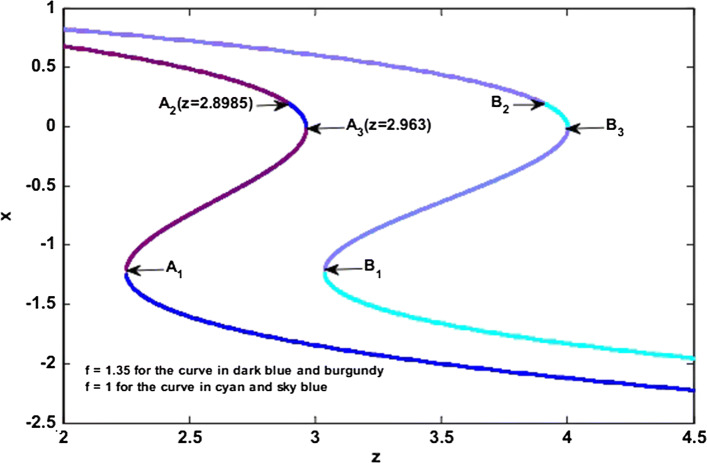
Fig. 7.
Equilibrium points of the fast-scale subsystem illustrating the different transitions that may justify the possible bifurcations which can occurs in the model. For f = 1 (respectively f = 1.35), the stable equilibrium points are represented by the cyan color (respectively dark blue color) while the unstable equilibrium points are represented in sky blue color (respectively burgundy color). (Color figure online)

