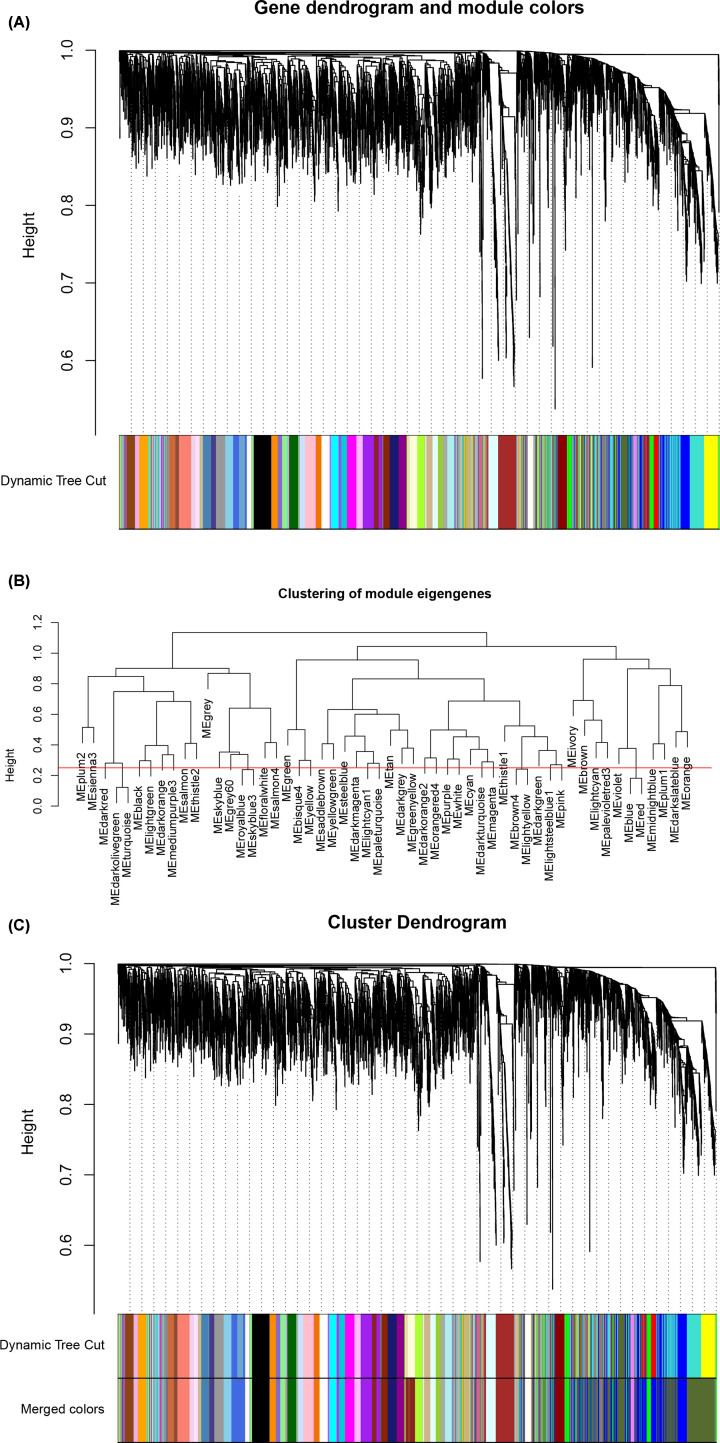
Figure 2. Module identification with WGCNA.
(A) Primary results of clustering tree construction and module identification. (B) Merging of modules with similar expression profiles. (C) Network dendrogram based on differential measurement and identified module colors. In the dendrogram of (A) and (C), each node represents a gene, and the vertical axis denotes the degree of topological differences between genes, i.e. a larger distance between vertical coordinates indicates a larger topological difference, meaning a weaker co-expression correlation; the horizontal axes represent different modules, with each color denoting a module and the width of color bar indicating the gene number in the module; Dynamic Tree Cut represents modules initially obtained through average-linkage hierarchical clustering. Merged colors denote the reconstructed modules after merging similar modules.

