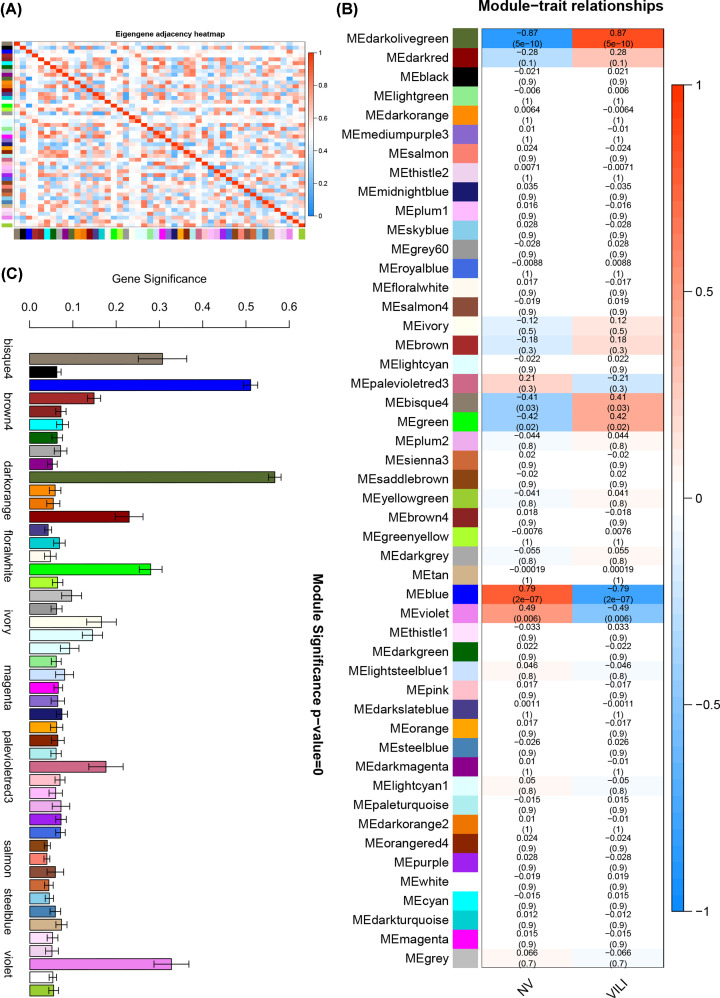
Figure 3. Correlation of module eigengenes and module–trait correlation.
(A) Heatmap for module eigengenes. The correlation of module eigengenes increases gradually with color changing from blue to red. (B) Heatmap for the correlation between modules and VILI traits. The horizontal axes represent different modules. The color of each cell indicates the corresponding module–trait correlation, a deeper red color suggesting stronger positive correlation and a deeper blue color suggesting stronger negative correlation. The value in each cell denotes the correlation score, and the value in the bracket below denotes the significance (P-value). (C) Module significance associated with VILI.

