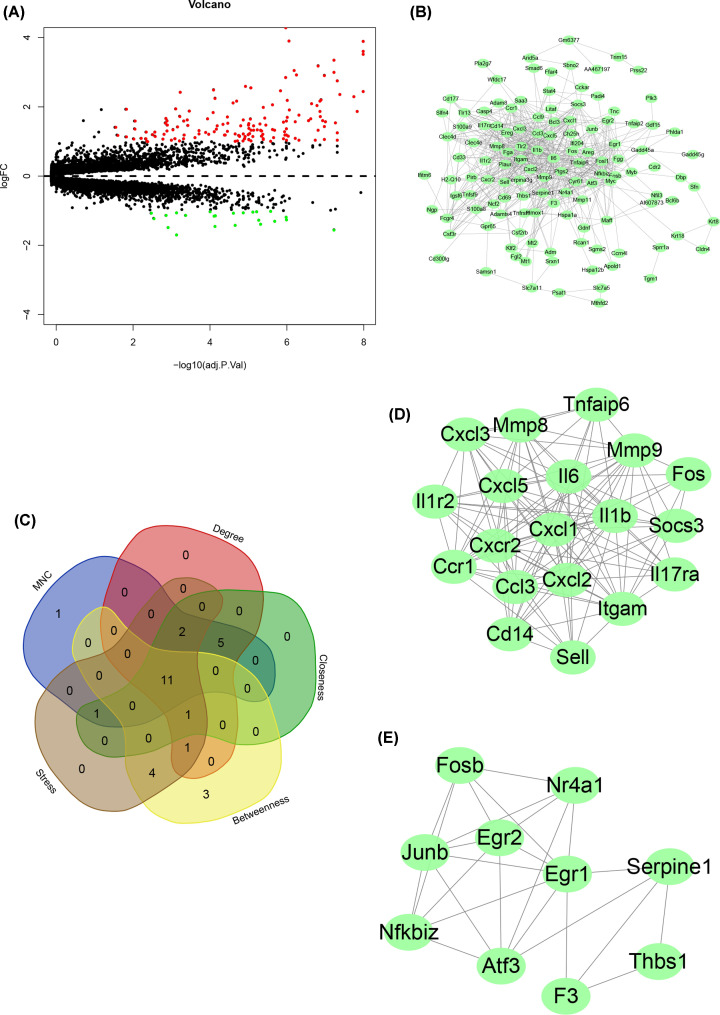
Figure 6. The analysis of DEGs in VILI.
(A) Volcano plot representing VILI-related DEGs. (B) PPI network of VILI-related DEGs. (C) Intersecting genes selected as hub genes by using five algorithms in CytoHubba. (D) The most significant module among PPI network. (E) The second most significant module among PPI network.

