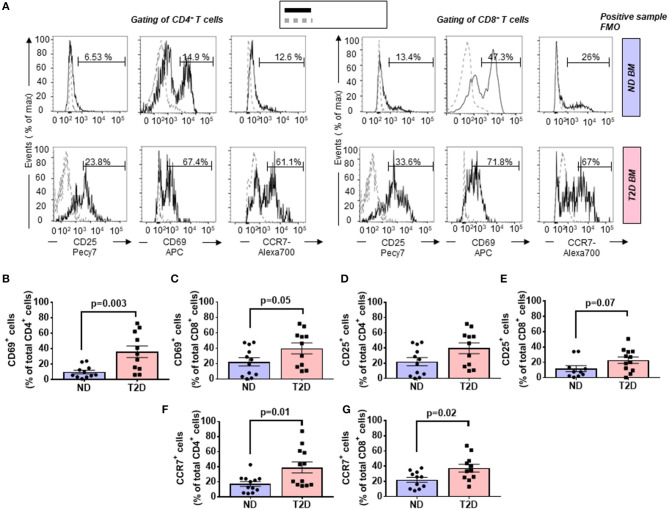
Figure 2.
Increased relative abundance of activated T cells in the bone marrow (BM) of patients with T2D. (A) Representative histogram overlays of CD4+ (left panels) and CD8+ cells (right panels) expressing the activation markers CD25 (late marker), CD69 (early marker), and chemokine receptor CCR7 (black line histogram) and FMO control (gray dotted histogram). BM-MCs were stained as described in Materials and Methods with mAb mixture containing BV771-CD45, PE-cy5-CD8, PE-cy5.5-CD4, PE-cy7-CD25, APC-CD69, and Alexa700-CCR7. Reported frequencies are illustrative of a representative case for each group. (B,C) Relative frequency of CD69 within CD4+ and CD8+ cells. (D,E) Relative frequency of CD25 within CD4+ and CD8+ cells. (F,G) Relative frequency of CCR7 within CD4+ and CD8+ cells. Values are mean ± SEM, with each point representing an individual case.

