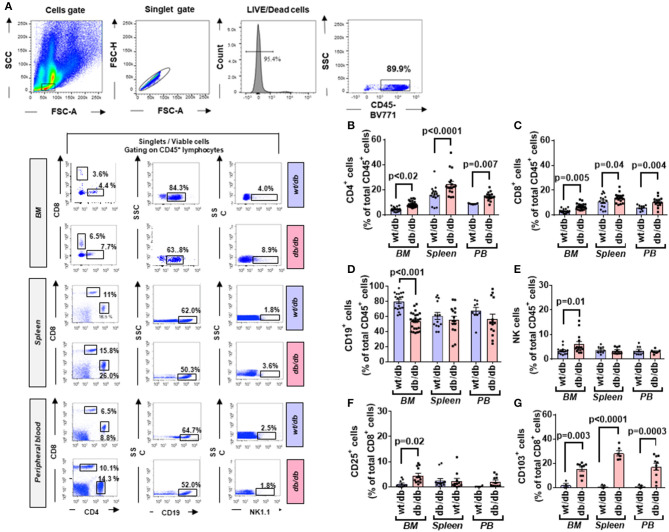
Figure 5.
Higher frequency and activated state of T lymphocytes in diabetic mice. (A) Gating strategy for identification of CD4, CD8, CD19, and NK1.1 positive cells in the BM, spleen, and peripheral blood of wt/db and db/db mice. Reported frequencies are illustrative of a representative case for each group. (B) Relative frequency of CD4+ cells. (C) Relative frequency of CD8+ cells. (D) Relative frequency of B cells. (E) Relative frequency of NK cells. (F) Relative frequency of CD8+ cells expressing the activation marker CD25. (G) Relative frequency of CD8+ cells expressing CD103. Values are mean ± SEM, with each point representing an individual case.

