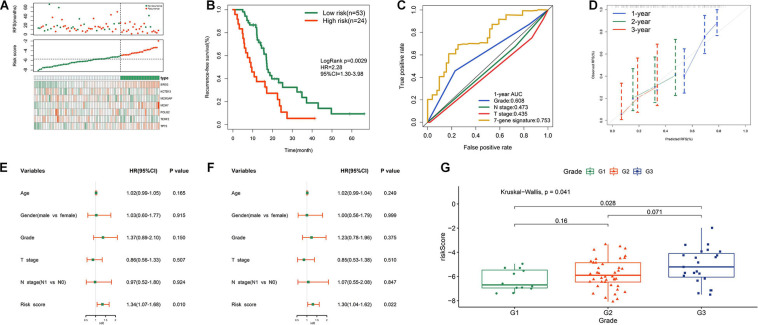
FIGURE 4.
Prognostic performance of risk signature in TCGA cohort. (A) From top to bottom are the patients’ survival overview, risk score, and heat map of seven prognostic genes expression. (B) K–M curves evaluating the RFS between low- and high-risk groups. (C) ROC curve analysis of risk score in TCGA cohort. (D) Calibration curves for risk score. (E) Univariate and (F) multivariate Cox regression analyses of parameters for RFS. (G) Distribution of risk scores with respect to grade.

