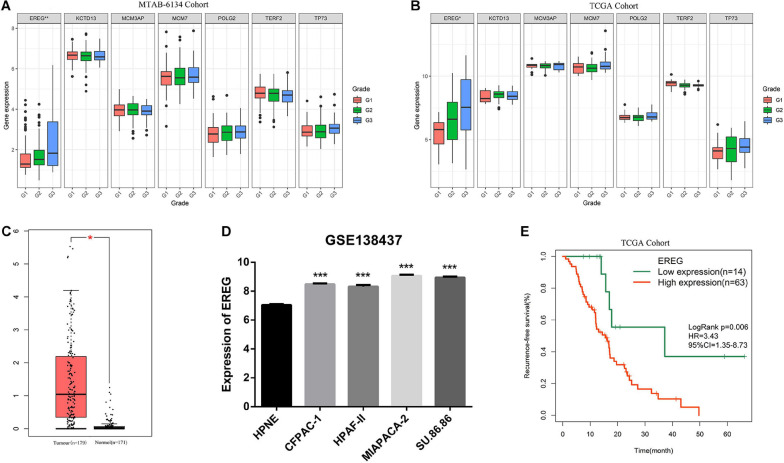
FIGURE 6.
Comprehensive analysis of EREG expression in PDAC. (A,B) Expression of EREG in PDAC patients stratified by histological grade in MTAB-6134 and TCGA cohorts. (C) Expression of EREG in tumor tissues and normal tissues. (D) Expression of EREG in pancreatic cell lines based on the RNA-sequencing data downloaded from GSE138437 dataset. (E) Survival curve for EREG in TCGA cohort. *p < 0.05; **p < 0.01; ***p < 0.001.

