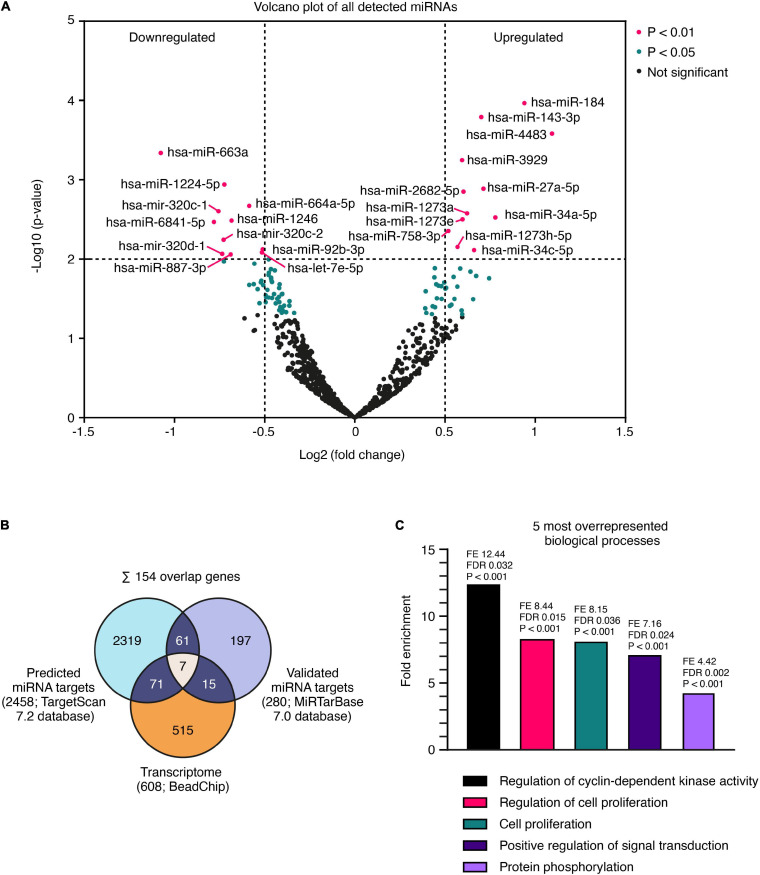
FIGURE 3.
miRNome-wide screen and overlap analysis with transcriptome data. (A) Volcano plot shows 796 detected miRNAs in SNCA vs. GFP overexpressing LUHMES neurons 4 days after adenoviral transduction. 55 miRNAs with P < 0.05 and 23 with P < 0.01 were differentially expressed (non-adjusted p-value). (B) Identification of 154 overlap genes of predicted miRNA target genes (TargetScan 7.2 database) and experimentally validated target genes (MiRTarBase 7.0 database) with miRNAs of P < 0.01, and significantly regulated mRNAs (Padj < 0.05; Benjamini–Hochberg FDR) from transcriptome analysis (BeadChip). (C) Overrepresented biological processes identified by PANTHER GO-Slim pathway analysis among 154 overlap genes.

