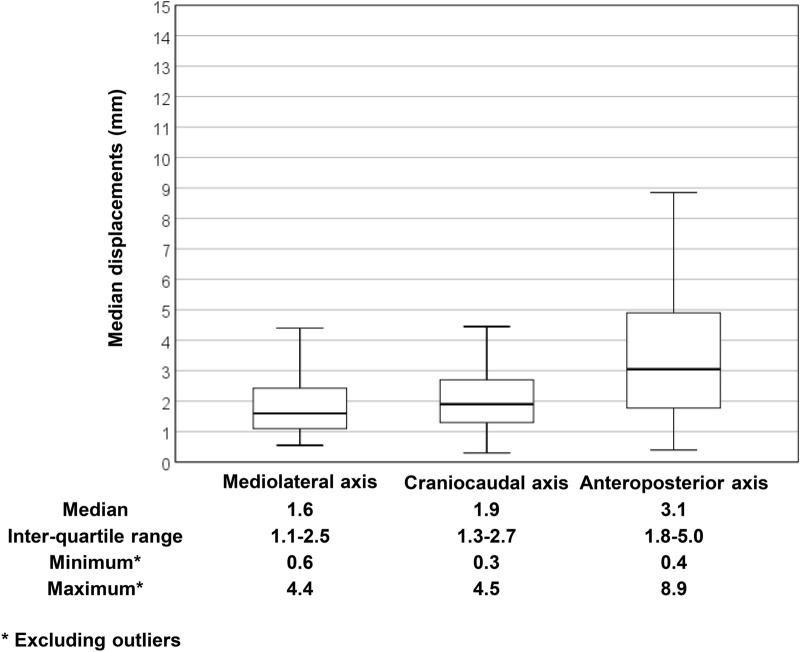
Figure 1.
Distribution of median interfractional displacements in the three major axes. The top end and the bottom end of the error bar are the maximum and minimum value excluding outliers of the interfractional displacements of three axes, respectively. The outliers were defined as larger (smaller) values than the upper (lower) boundary, which were defined as 1.5 IQR above (below) 75th (25th) percentile. Figure created in IBM SPSS, version 23.0 (https://www.ibm.com/analytics/spss-statistics-sofware).

